We’ve added a Grafana Monitoring and Logging system to our Home Lab. The system is based on Grafana, Prometheus, Grafana Loki, Promtail, Telegraf, and InFlux DB.
Installation
The following video covers the installation of our Grafana Monitoring and Logging monitoring stack.
Setup Logging and Monitoring in Docker
Configure Loki and Promtail
Grafana Lofi and Promtail work together to scape and store log data. These tools can scrape docker data and accept syslog data as well. The following video explains how to configure Loki and Promtail.
Configure Grafana Loki and Promtail for logs
There are a few details that we needed to do differently than the video:
- We had to configure a tsdb schema for Loki
- The links for configuring the Loki Docker driver can be found here and here.
- Set parameters in the Loki Docker driver via /etc/docker/daemon.json to avoid blocking the Docker.
- Recreating containers with Portainer does not enable Lofi to access their logs. To make this work, we needed to use docker compose up -d –force-recreate
The contents of /etc/docker/daemon.json are as follows:
{
  "log-driver": "loki",
  "log-opts": {
     "loki-url": "http://localhost:3100/loki/api/v1/push",
      "loki-batch-size": "400",
      "loki-retries": "2",
      "loki-max-backoff": "800ms",
      "loki-timeout": "1s",
      "keep-file": "true",
      "mode": "non-blocking"
    }
}
Syslog
We have configured a combination of Loki and Promtail to accept Syslog events. Promtail does not support Syslog events using the UDP protocol. To solve this problem, we set up rsyslog running under the Ubuntu system, which hosts the Promtail Docker container, to consolidate and forward all Syslog events as a front end to Promtail. Information on configuring rsyslog as a front end to Promtail can be found here.
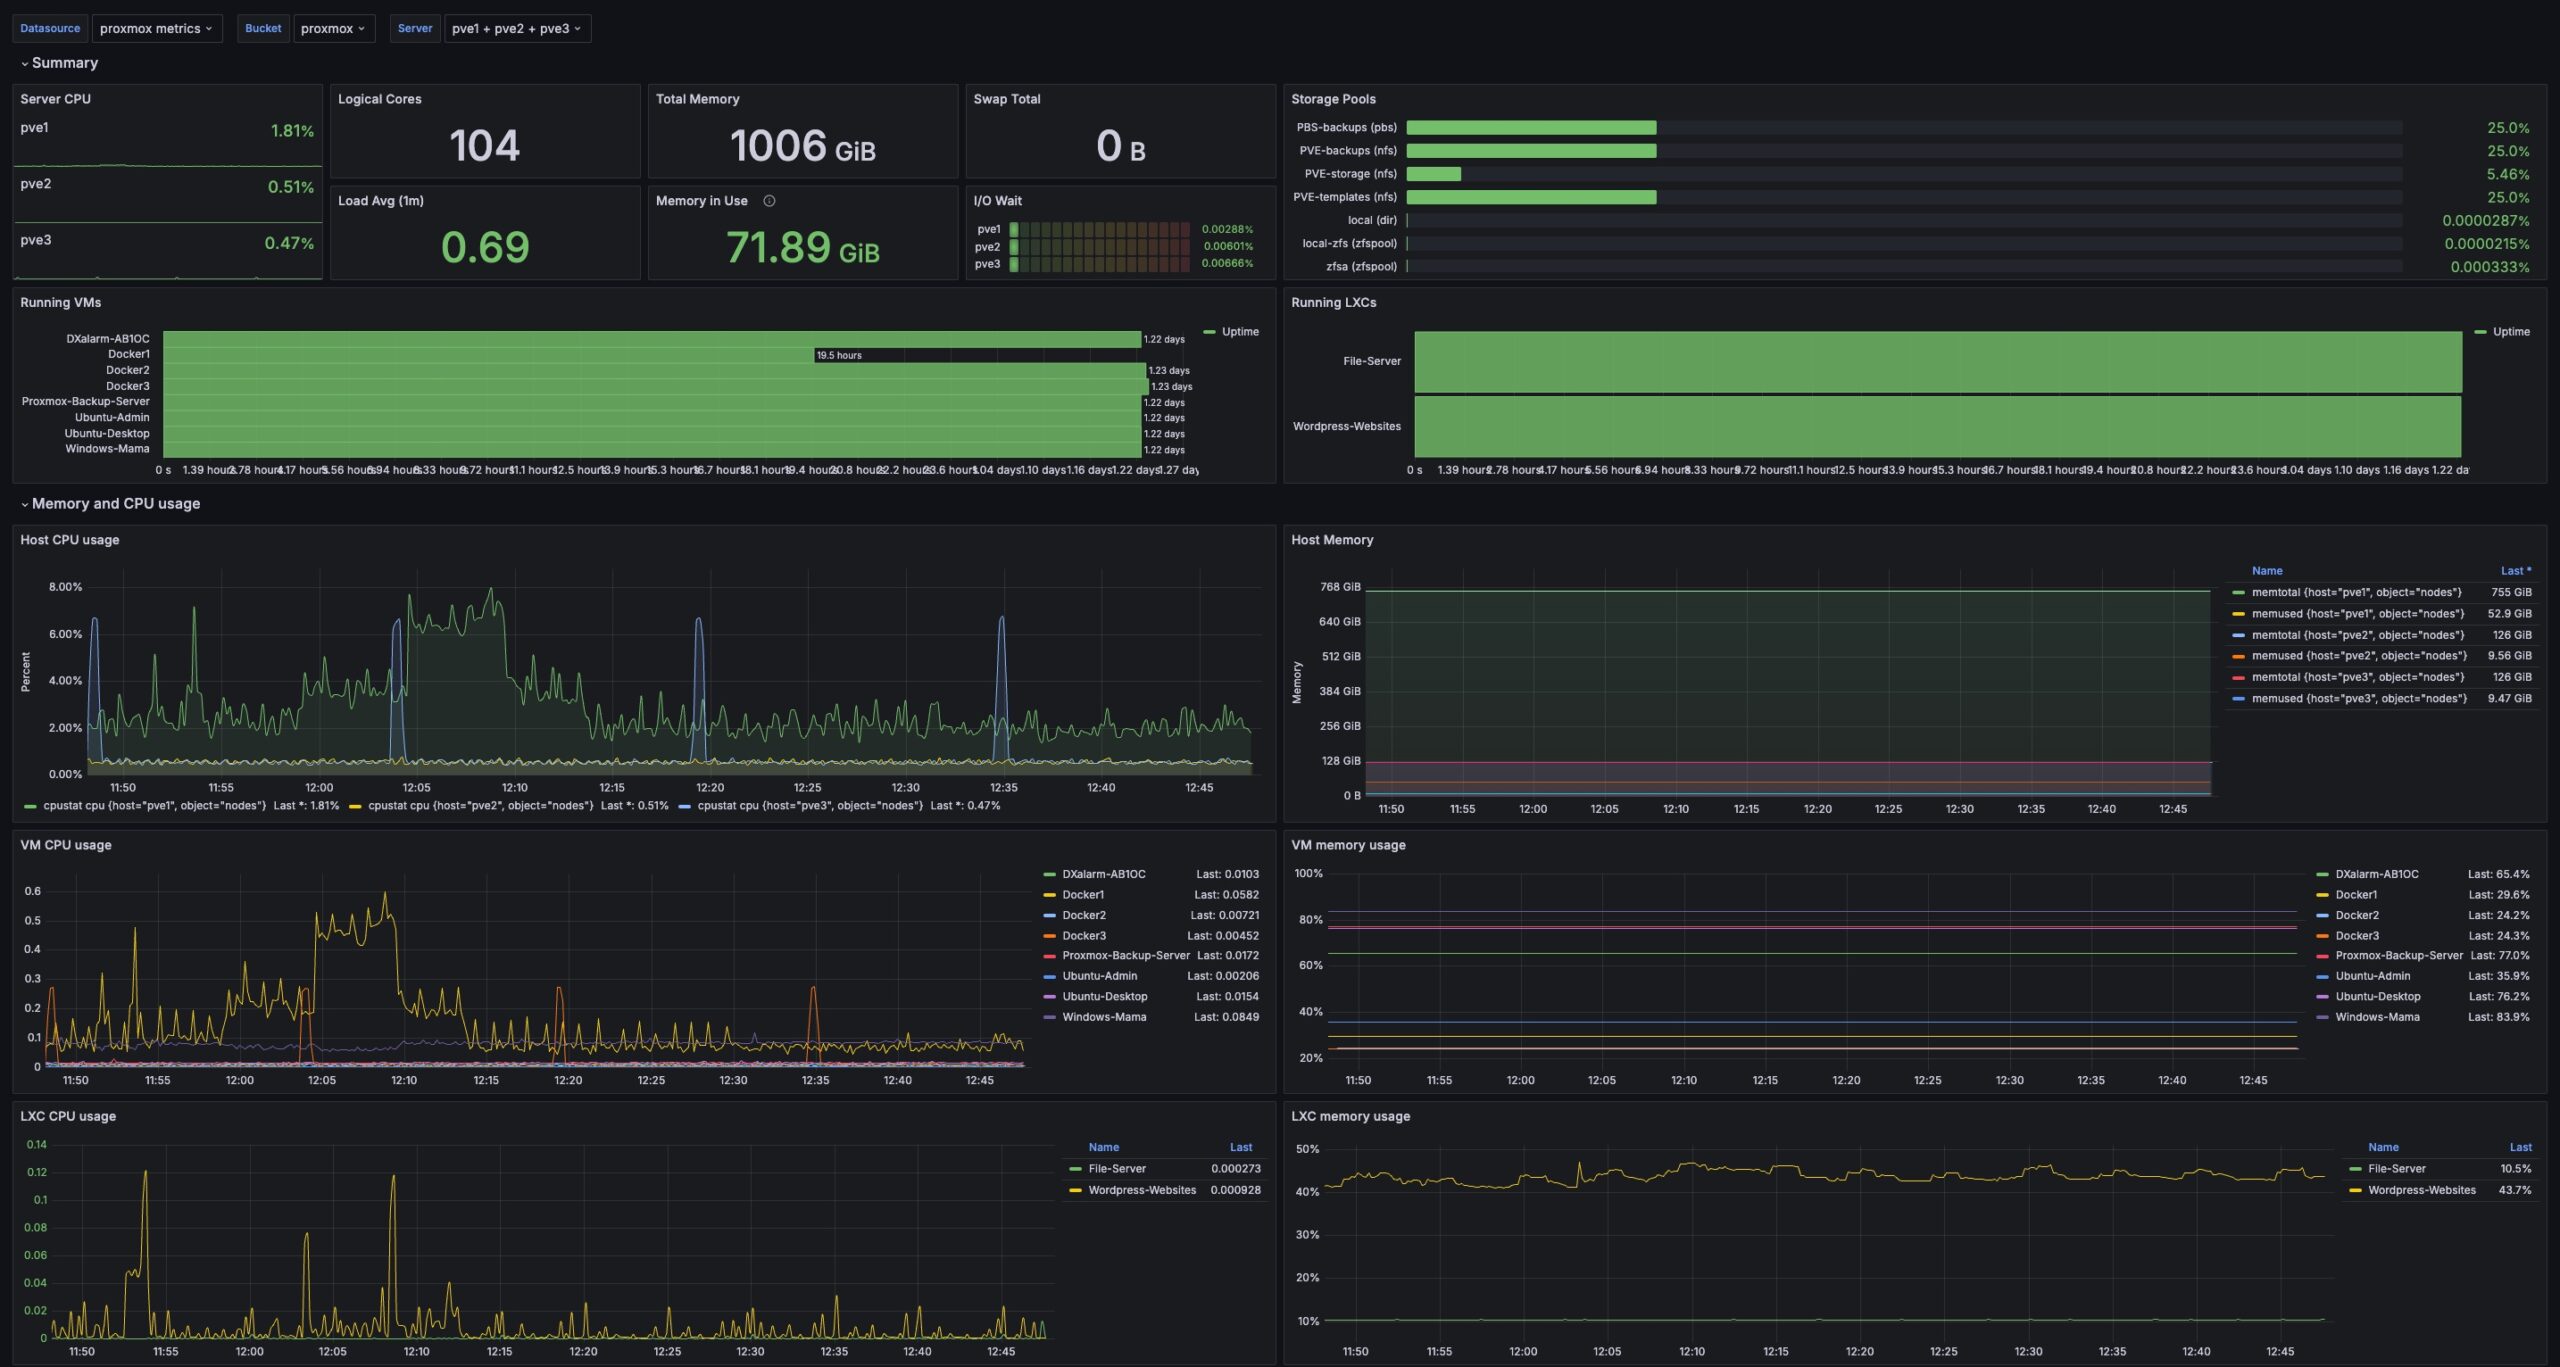
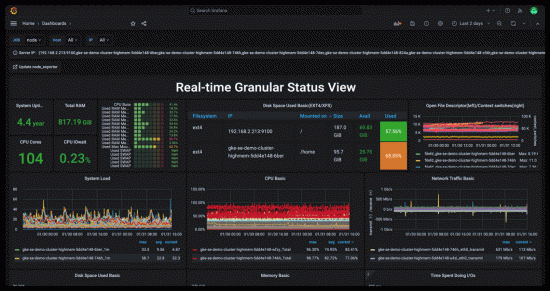
Monitoring Dashboards
The following video provides some information on configuring dashboards and other monitoring capabilities.
Create and Configure Grafana Dashboards