Many of our applications and services run as Docker containers. Our monitoring dashboard solution covers two aspects of Docker container performance:
- Docker Host VM performance via Node Exporter
- Windows VM performance via Windows Exporter
- Docker Container performance via cAdvisor
These data collectors enable several Grafana dashboards that help us manage our Docker cluster.
Monitoring Setup
We run a combination of Node Exporter and cAdvisor on each Docker host VMs. These containers scrape data for our Docker hosts and feed it to the Prometheus instance in our Docker stack.
The following video explains how all of this is set up –
Dashboards
We are using several dashboards to implement our Docker monitoring solution.
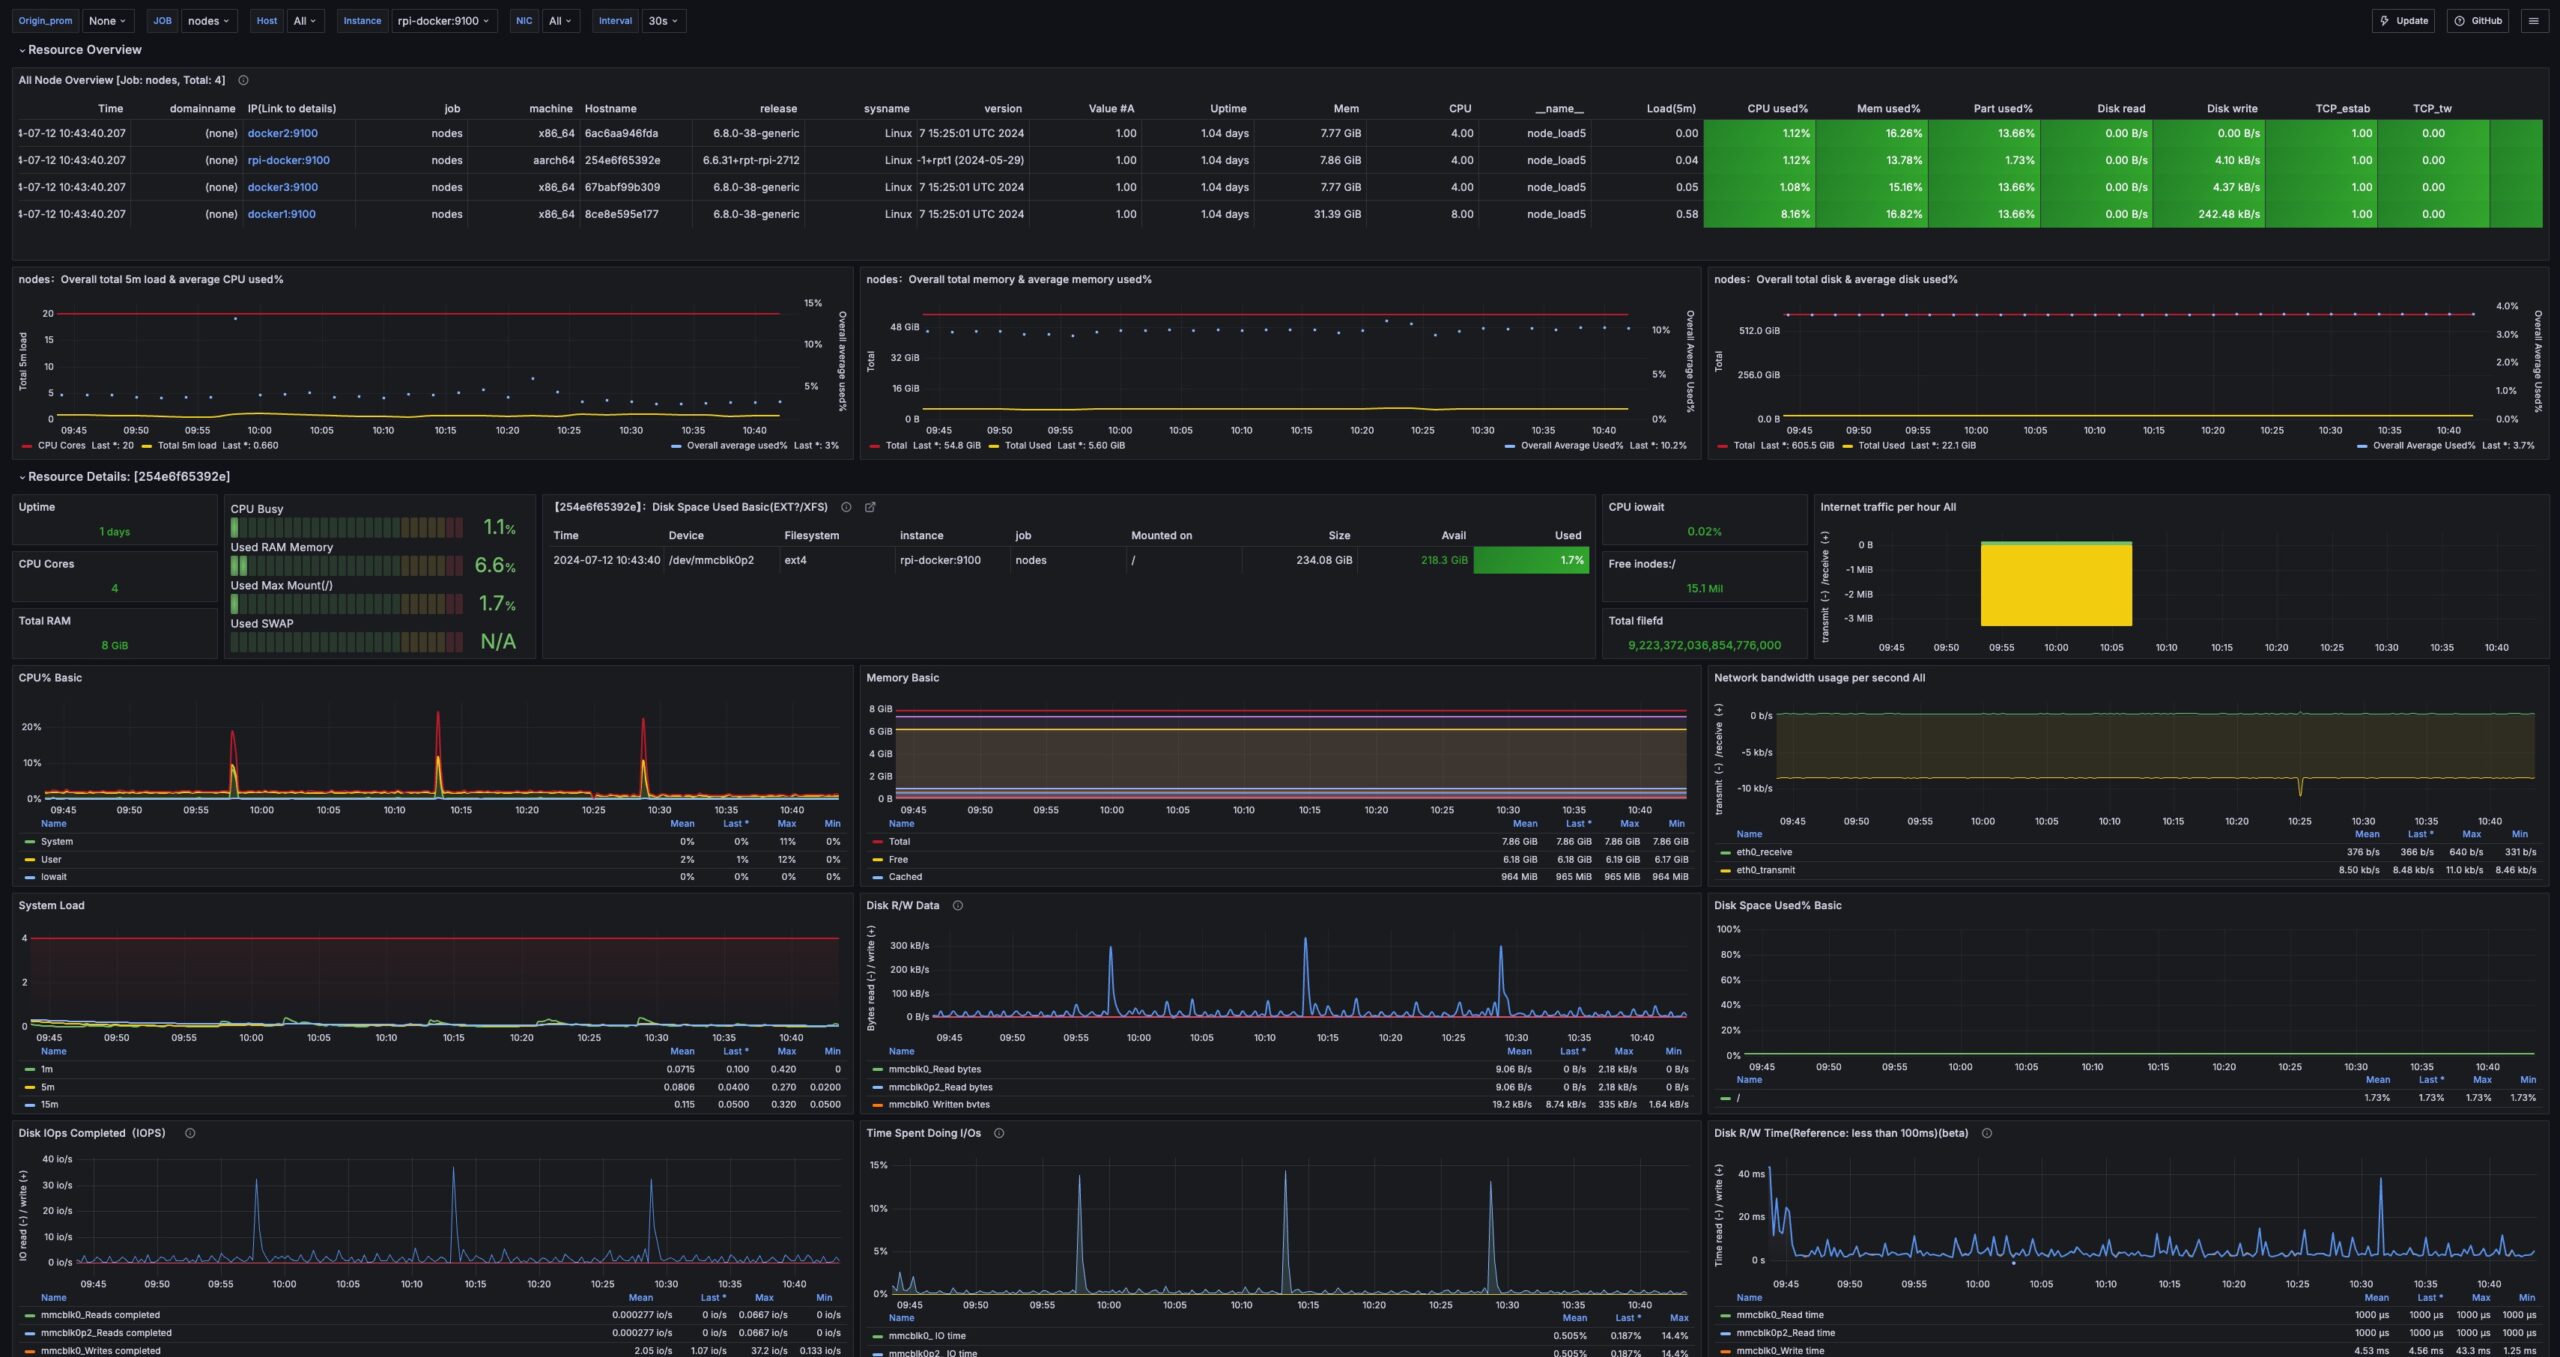
Docker Node Summary
We are using a modified version of the Grafana Dashboard above to monitor the overall performance of our Docker nodes.
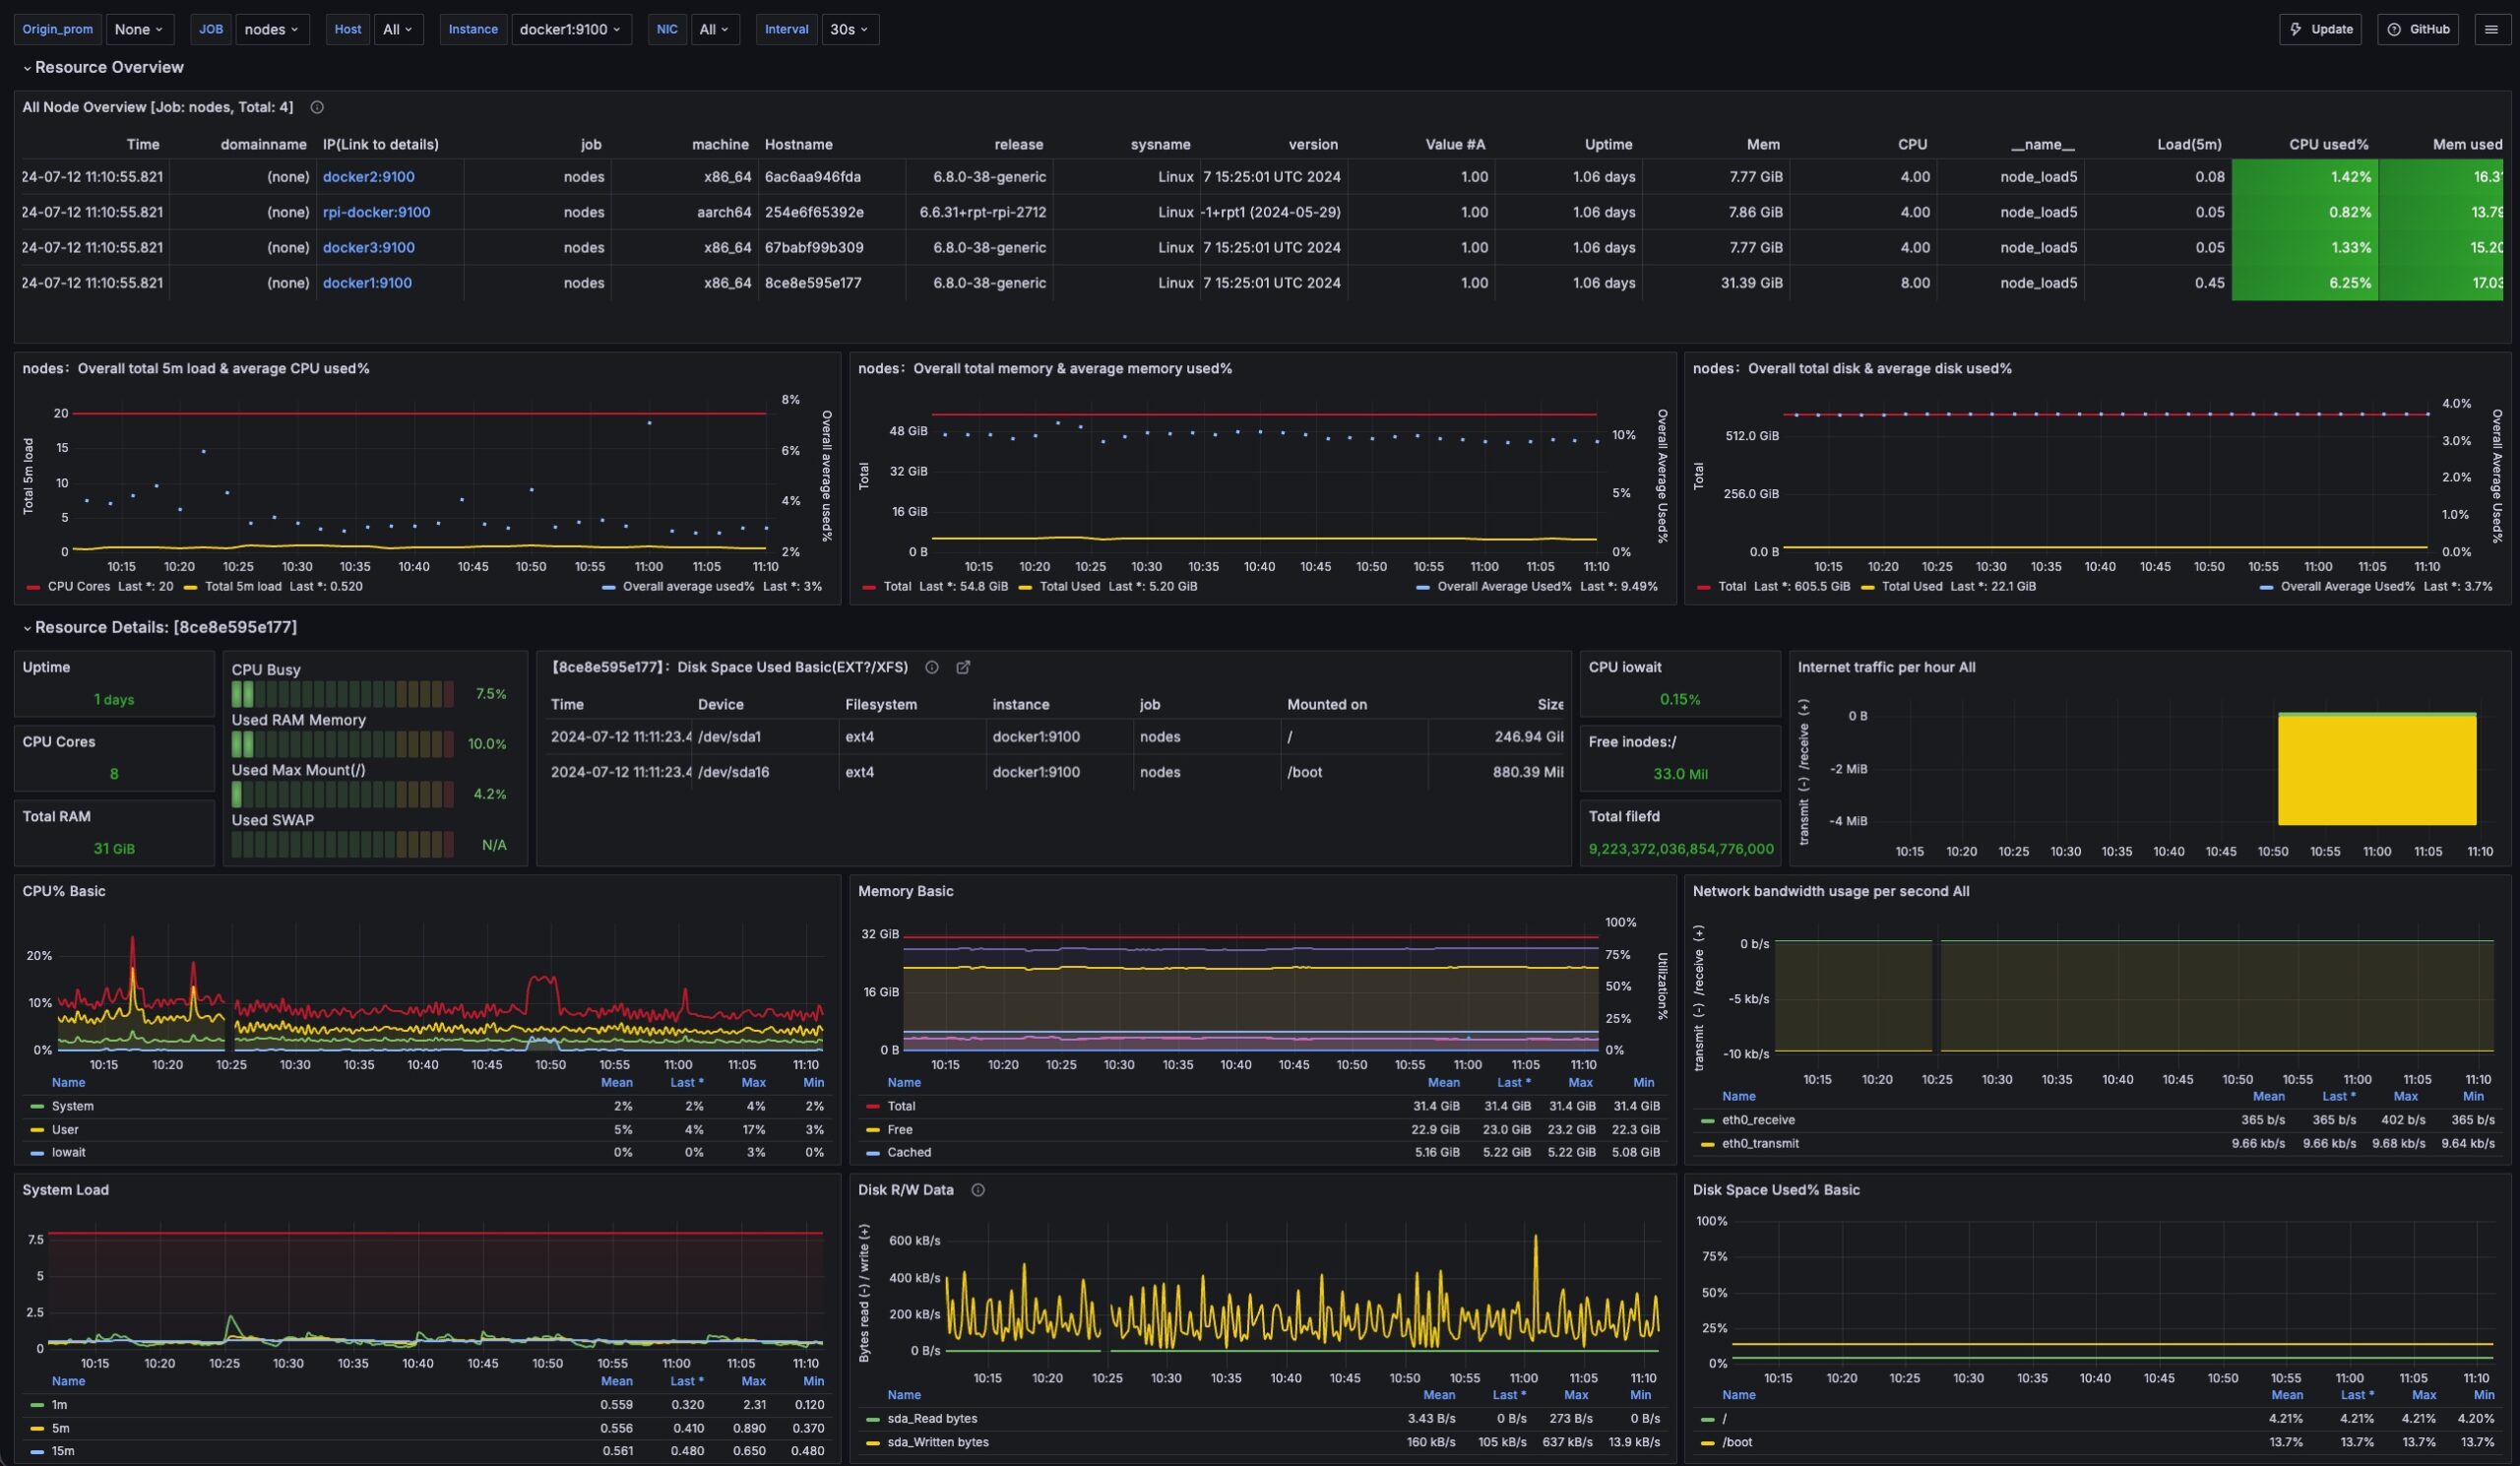
Docker Node Details
We are using a modified version of the Grafana Dashboard above to monitor and enable drilling into detailed performance metrics for our Docker nodes.
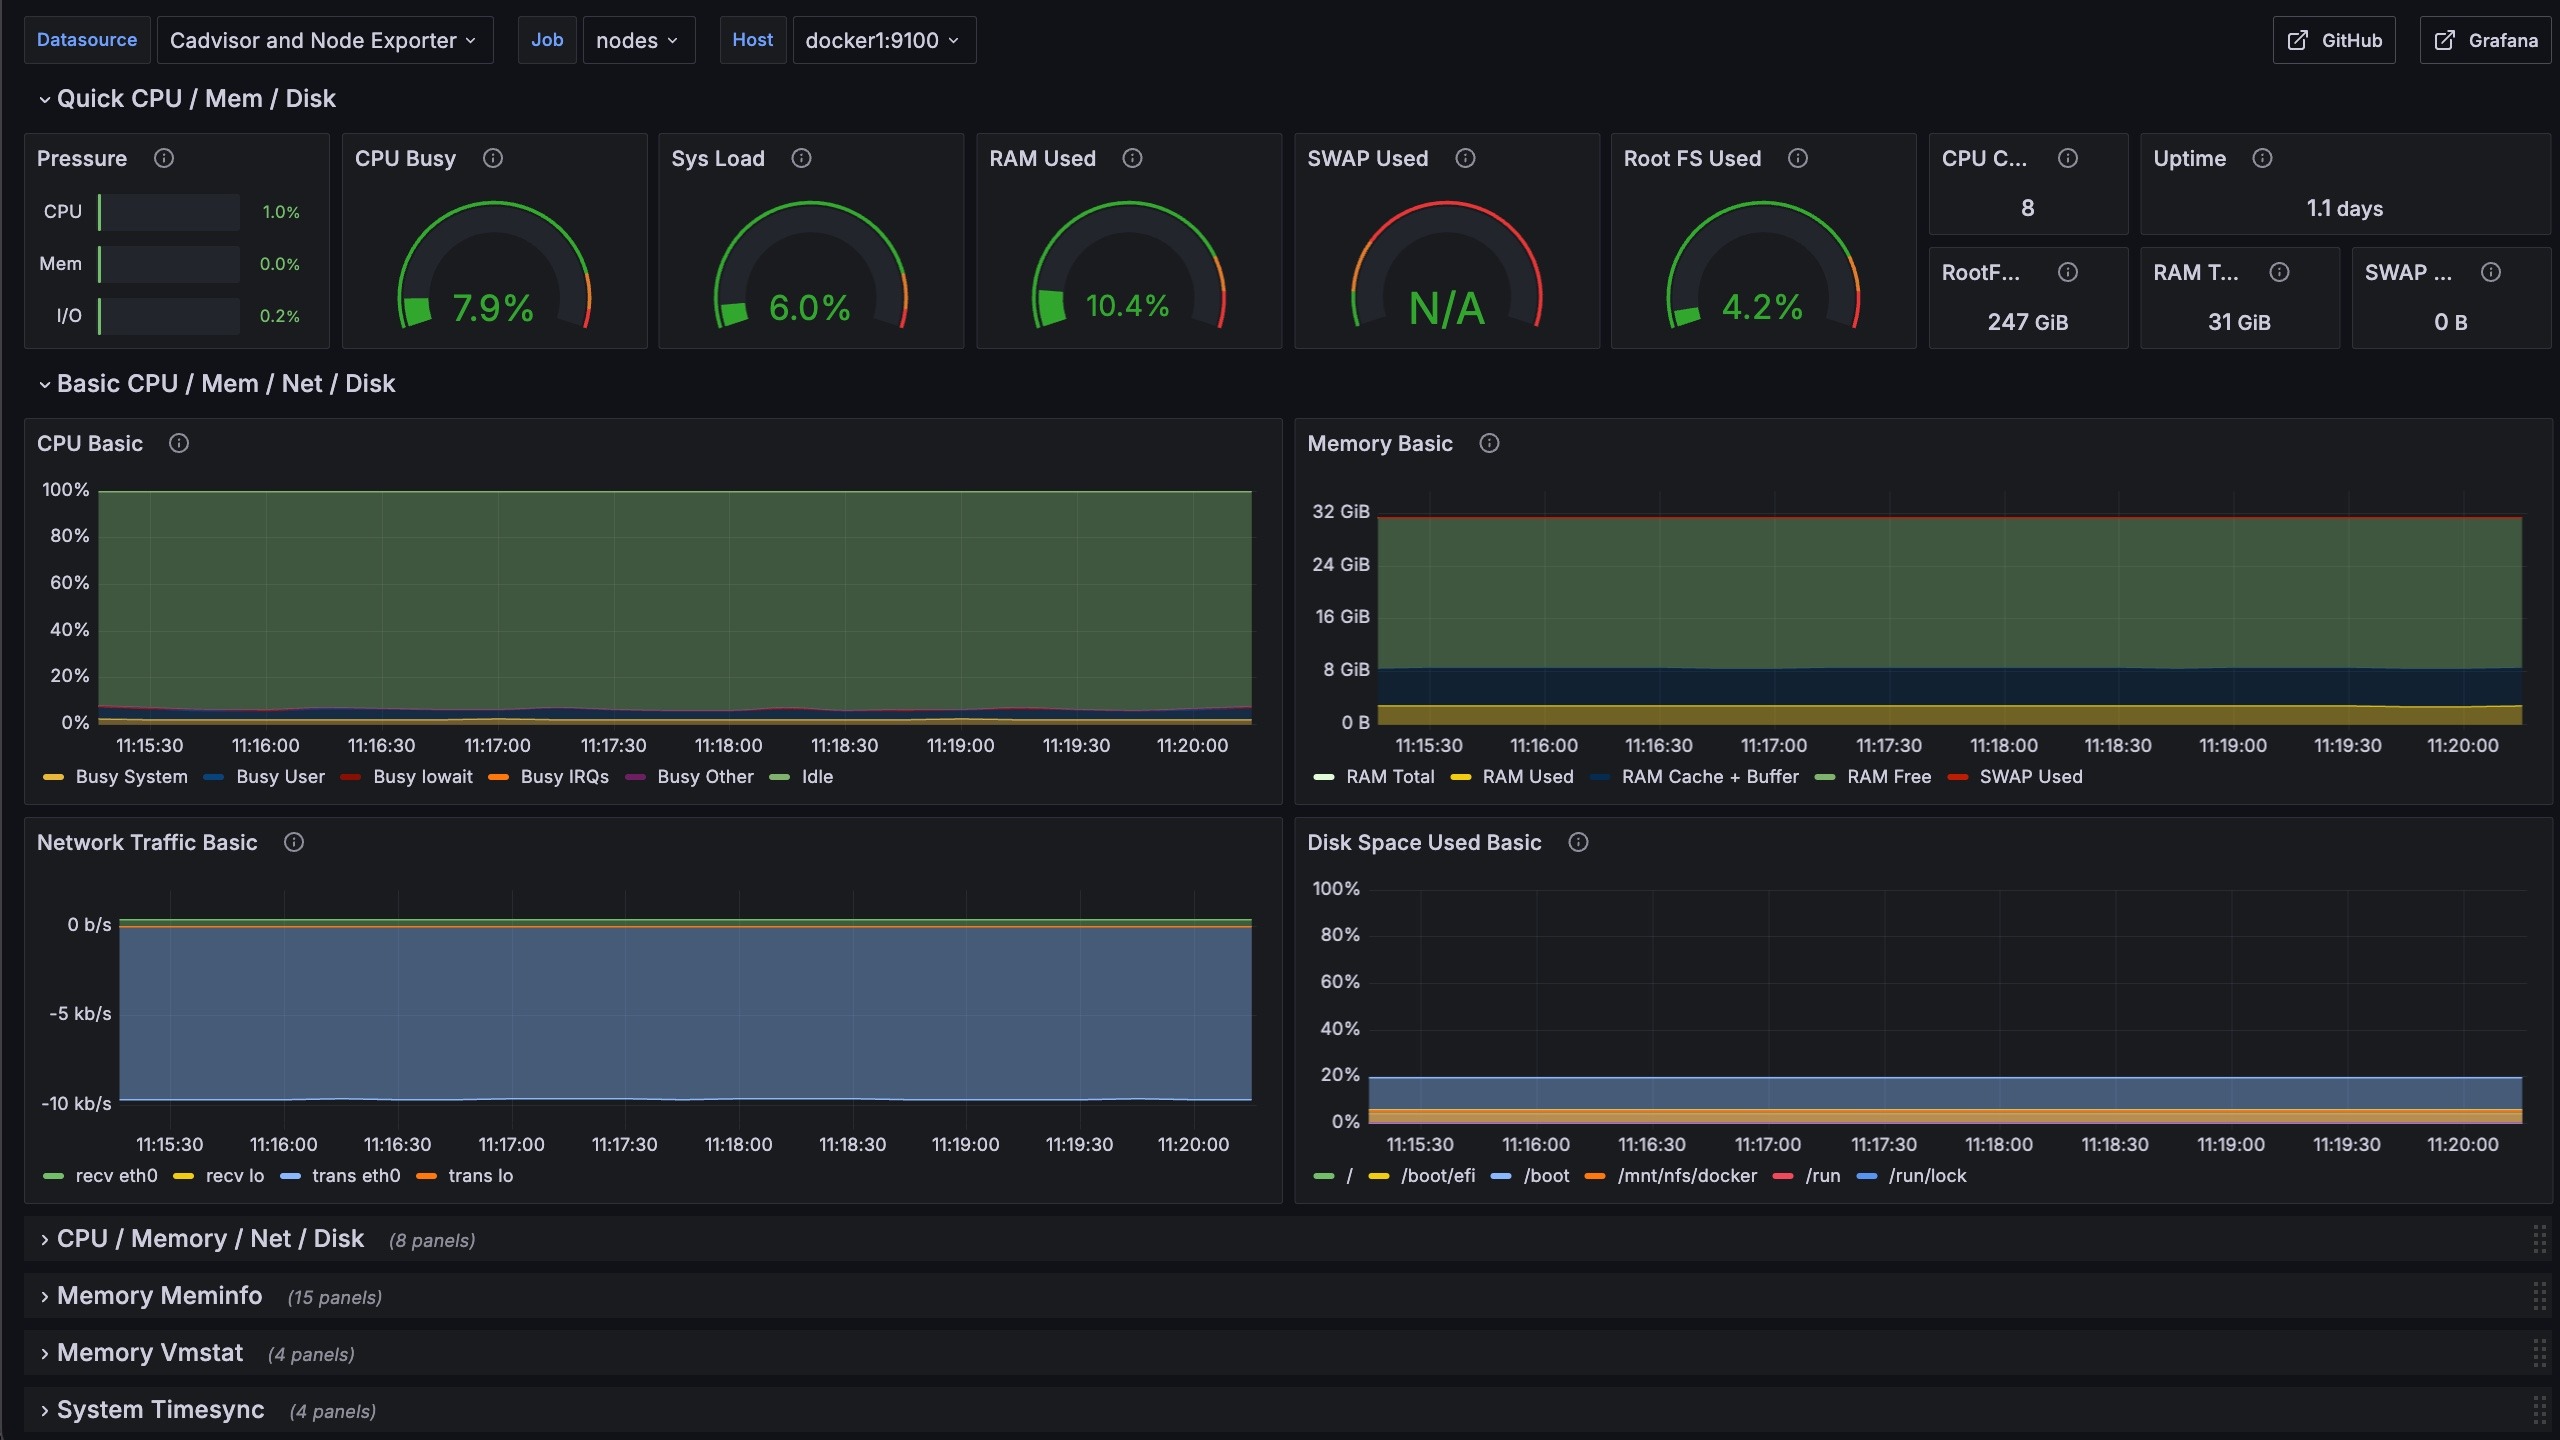
Docker Container Summary
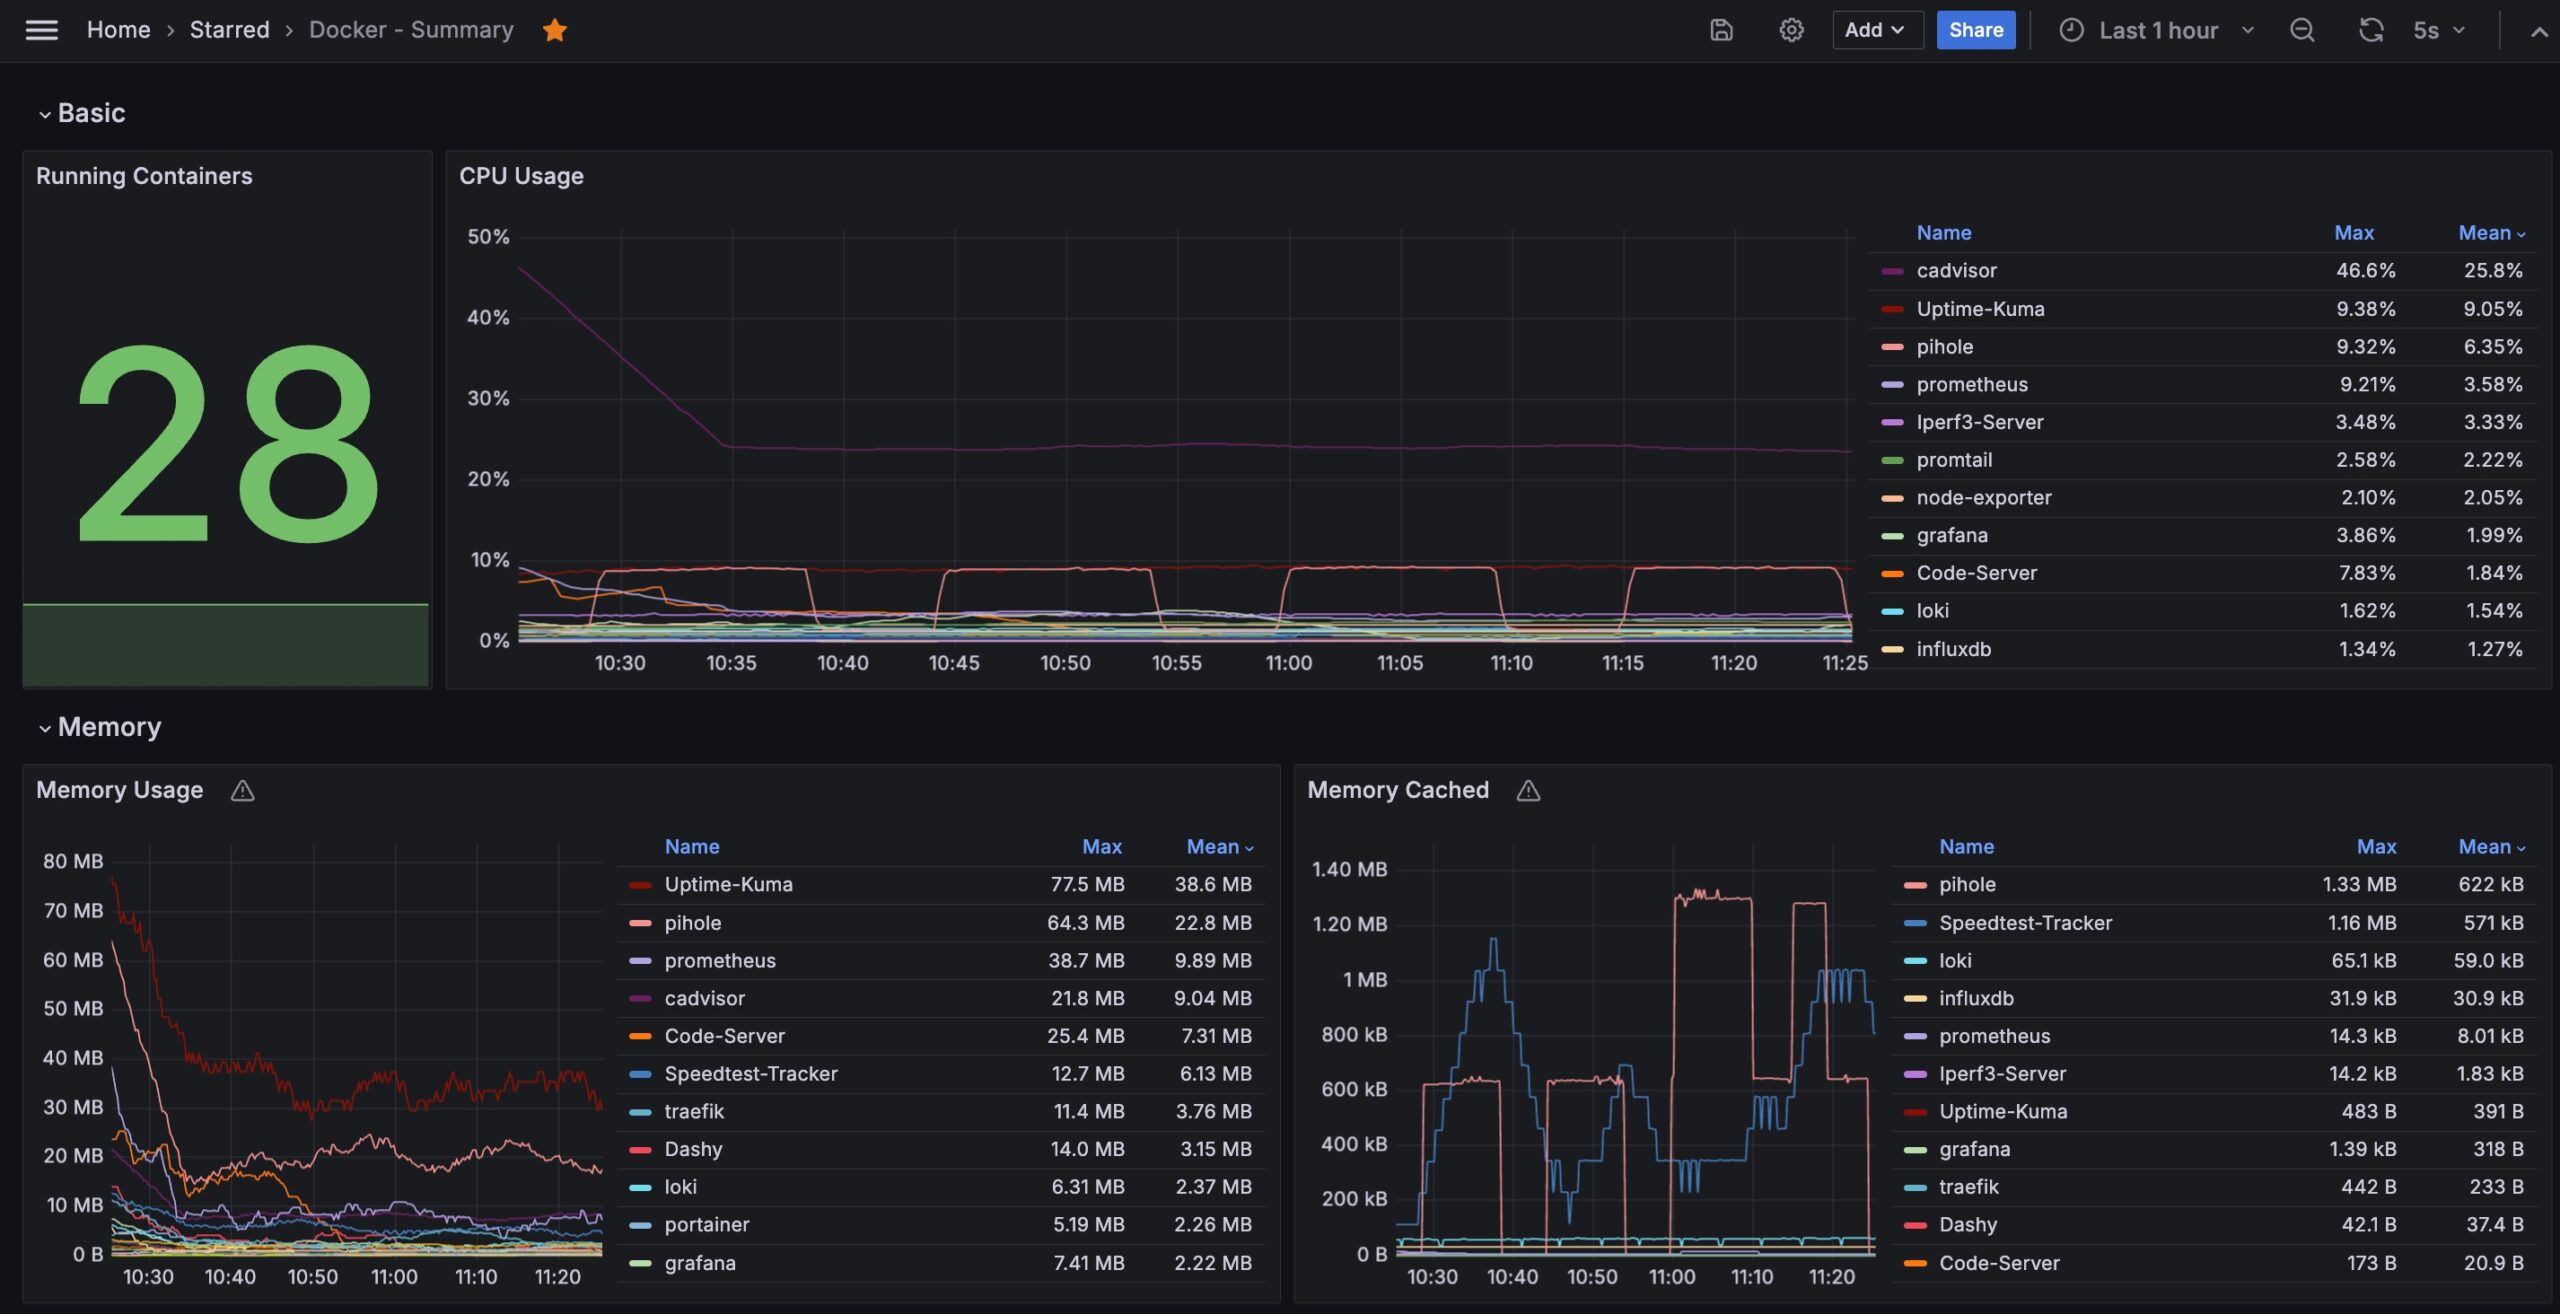
We are using a modified version of the Grafana Dashboard above to monitor and enable a summary view of the containers in our Docker cluster.
Docker Container Details
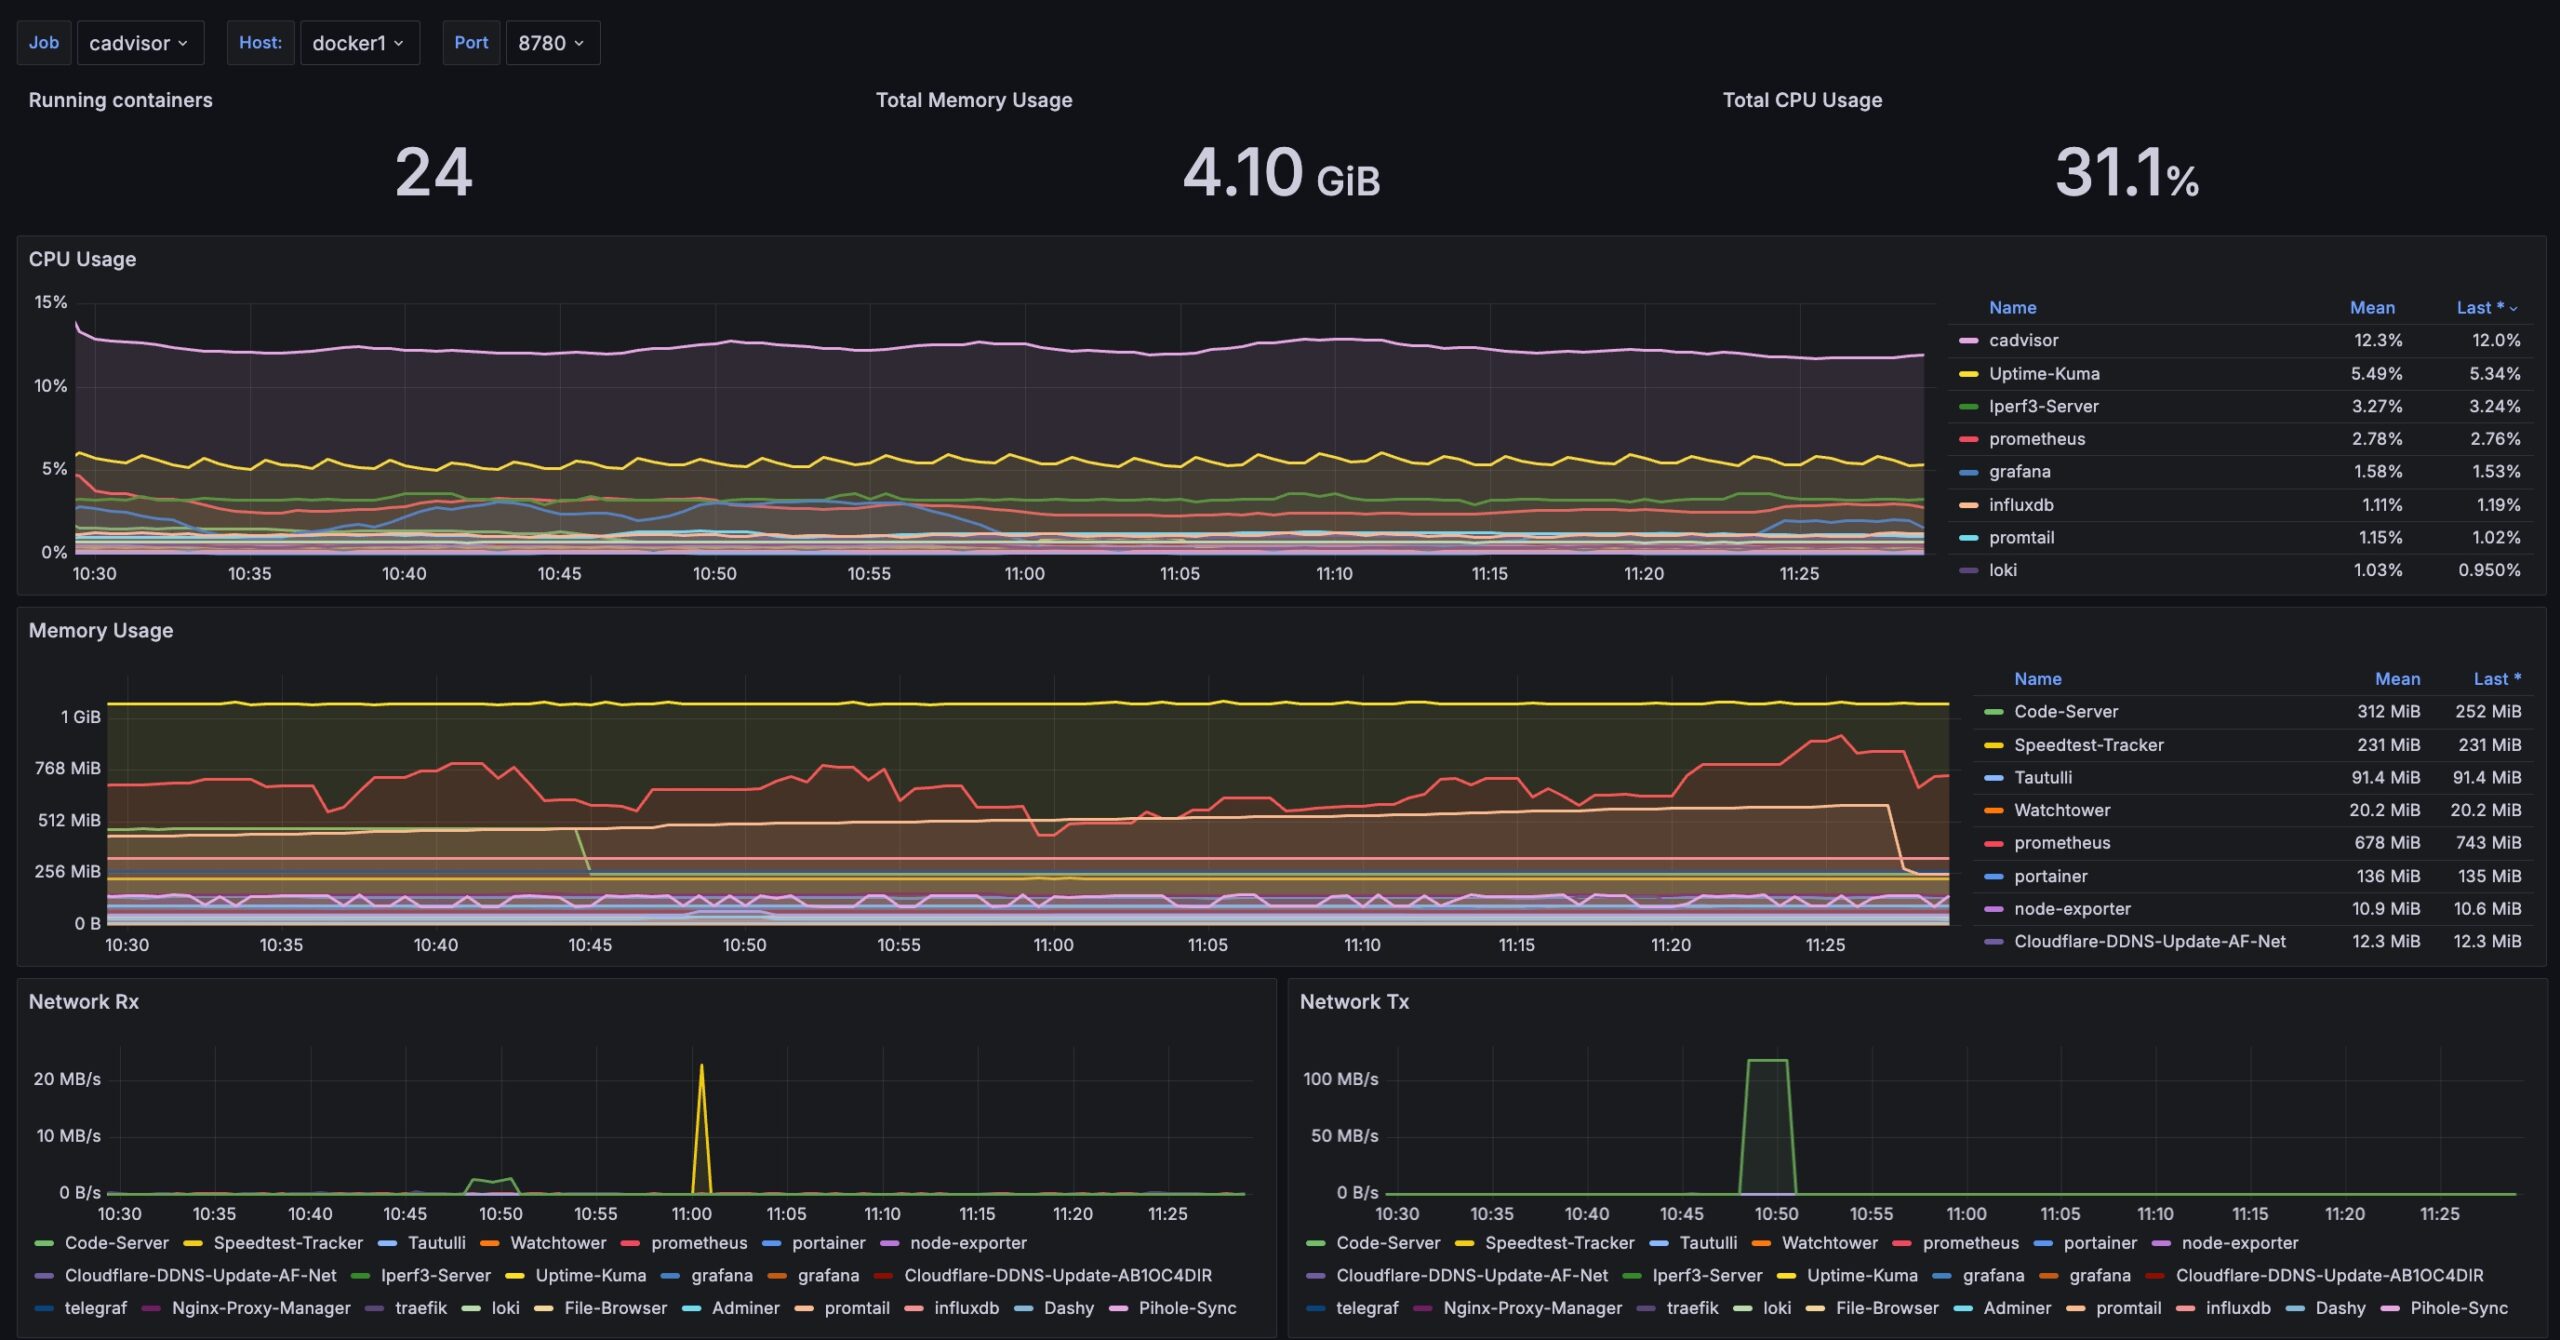
We are using a modified version of the Grafana Dashboard above to monitor and enable drilling into the detailed performance of containers in our Docker cluster.
Windows VM Dashboard
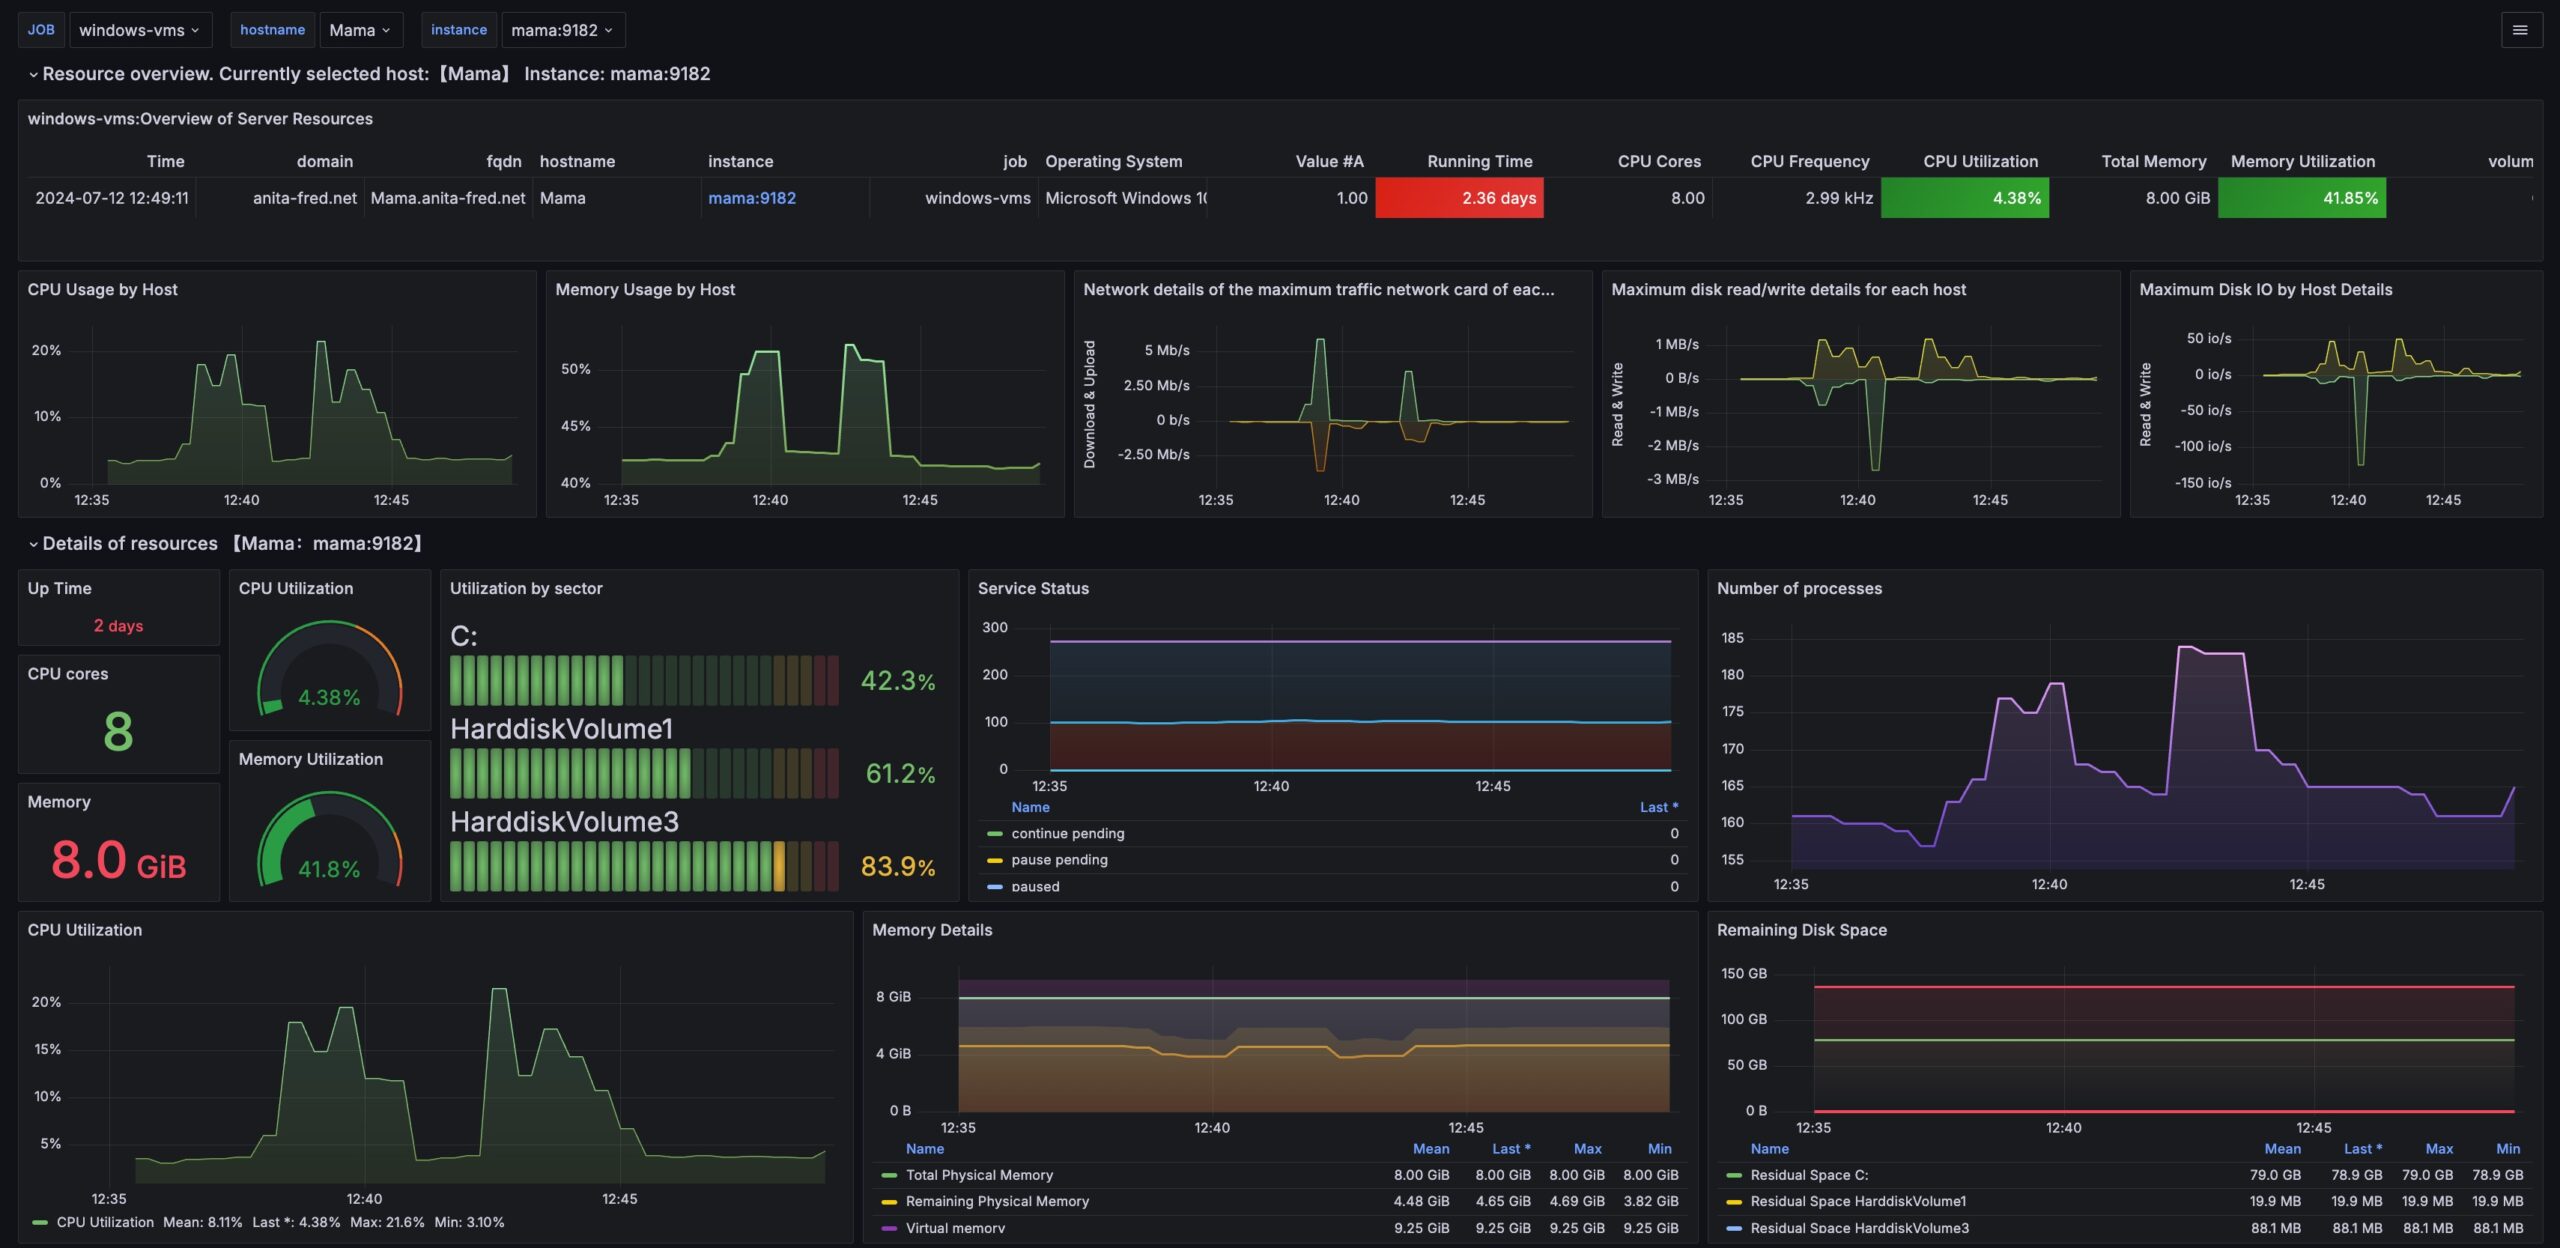
We are using a modified version of the Grafana Dashboard above to monitor and enable drilling into the performance of Windows VMs in our Docker cluster.