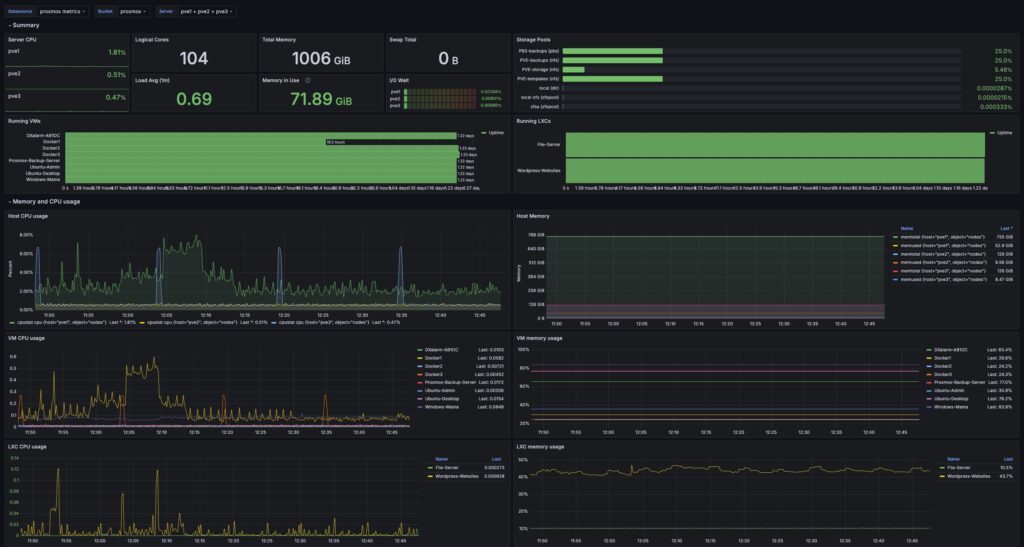
We set up a Grafana Dashboard to implement Proxmox Monitoring. The main components in our monitoring stack include:
- A Proxmox Metric Server running in our Proxmox Cluster
- Influx DB (part of our Grafana Logging and Monitoring stack) to store the metrics data
- A Grafana Dashboard to display the Proxmox metrics
The following sections cover the setup and configuration of our monitoring stack.
Proxmox Monitoring Setup
The following video explains how to set up a Grafana dashboard for Proxmox. This installation uses the monitoring function built into Proxmox to feed data to Influx DB.
And here is a video that explains setting up self-signed certificates –
Configuring Self-Signed Certificates
We are using the Proxmox [Flux] dashboard with our setup.
