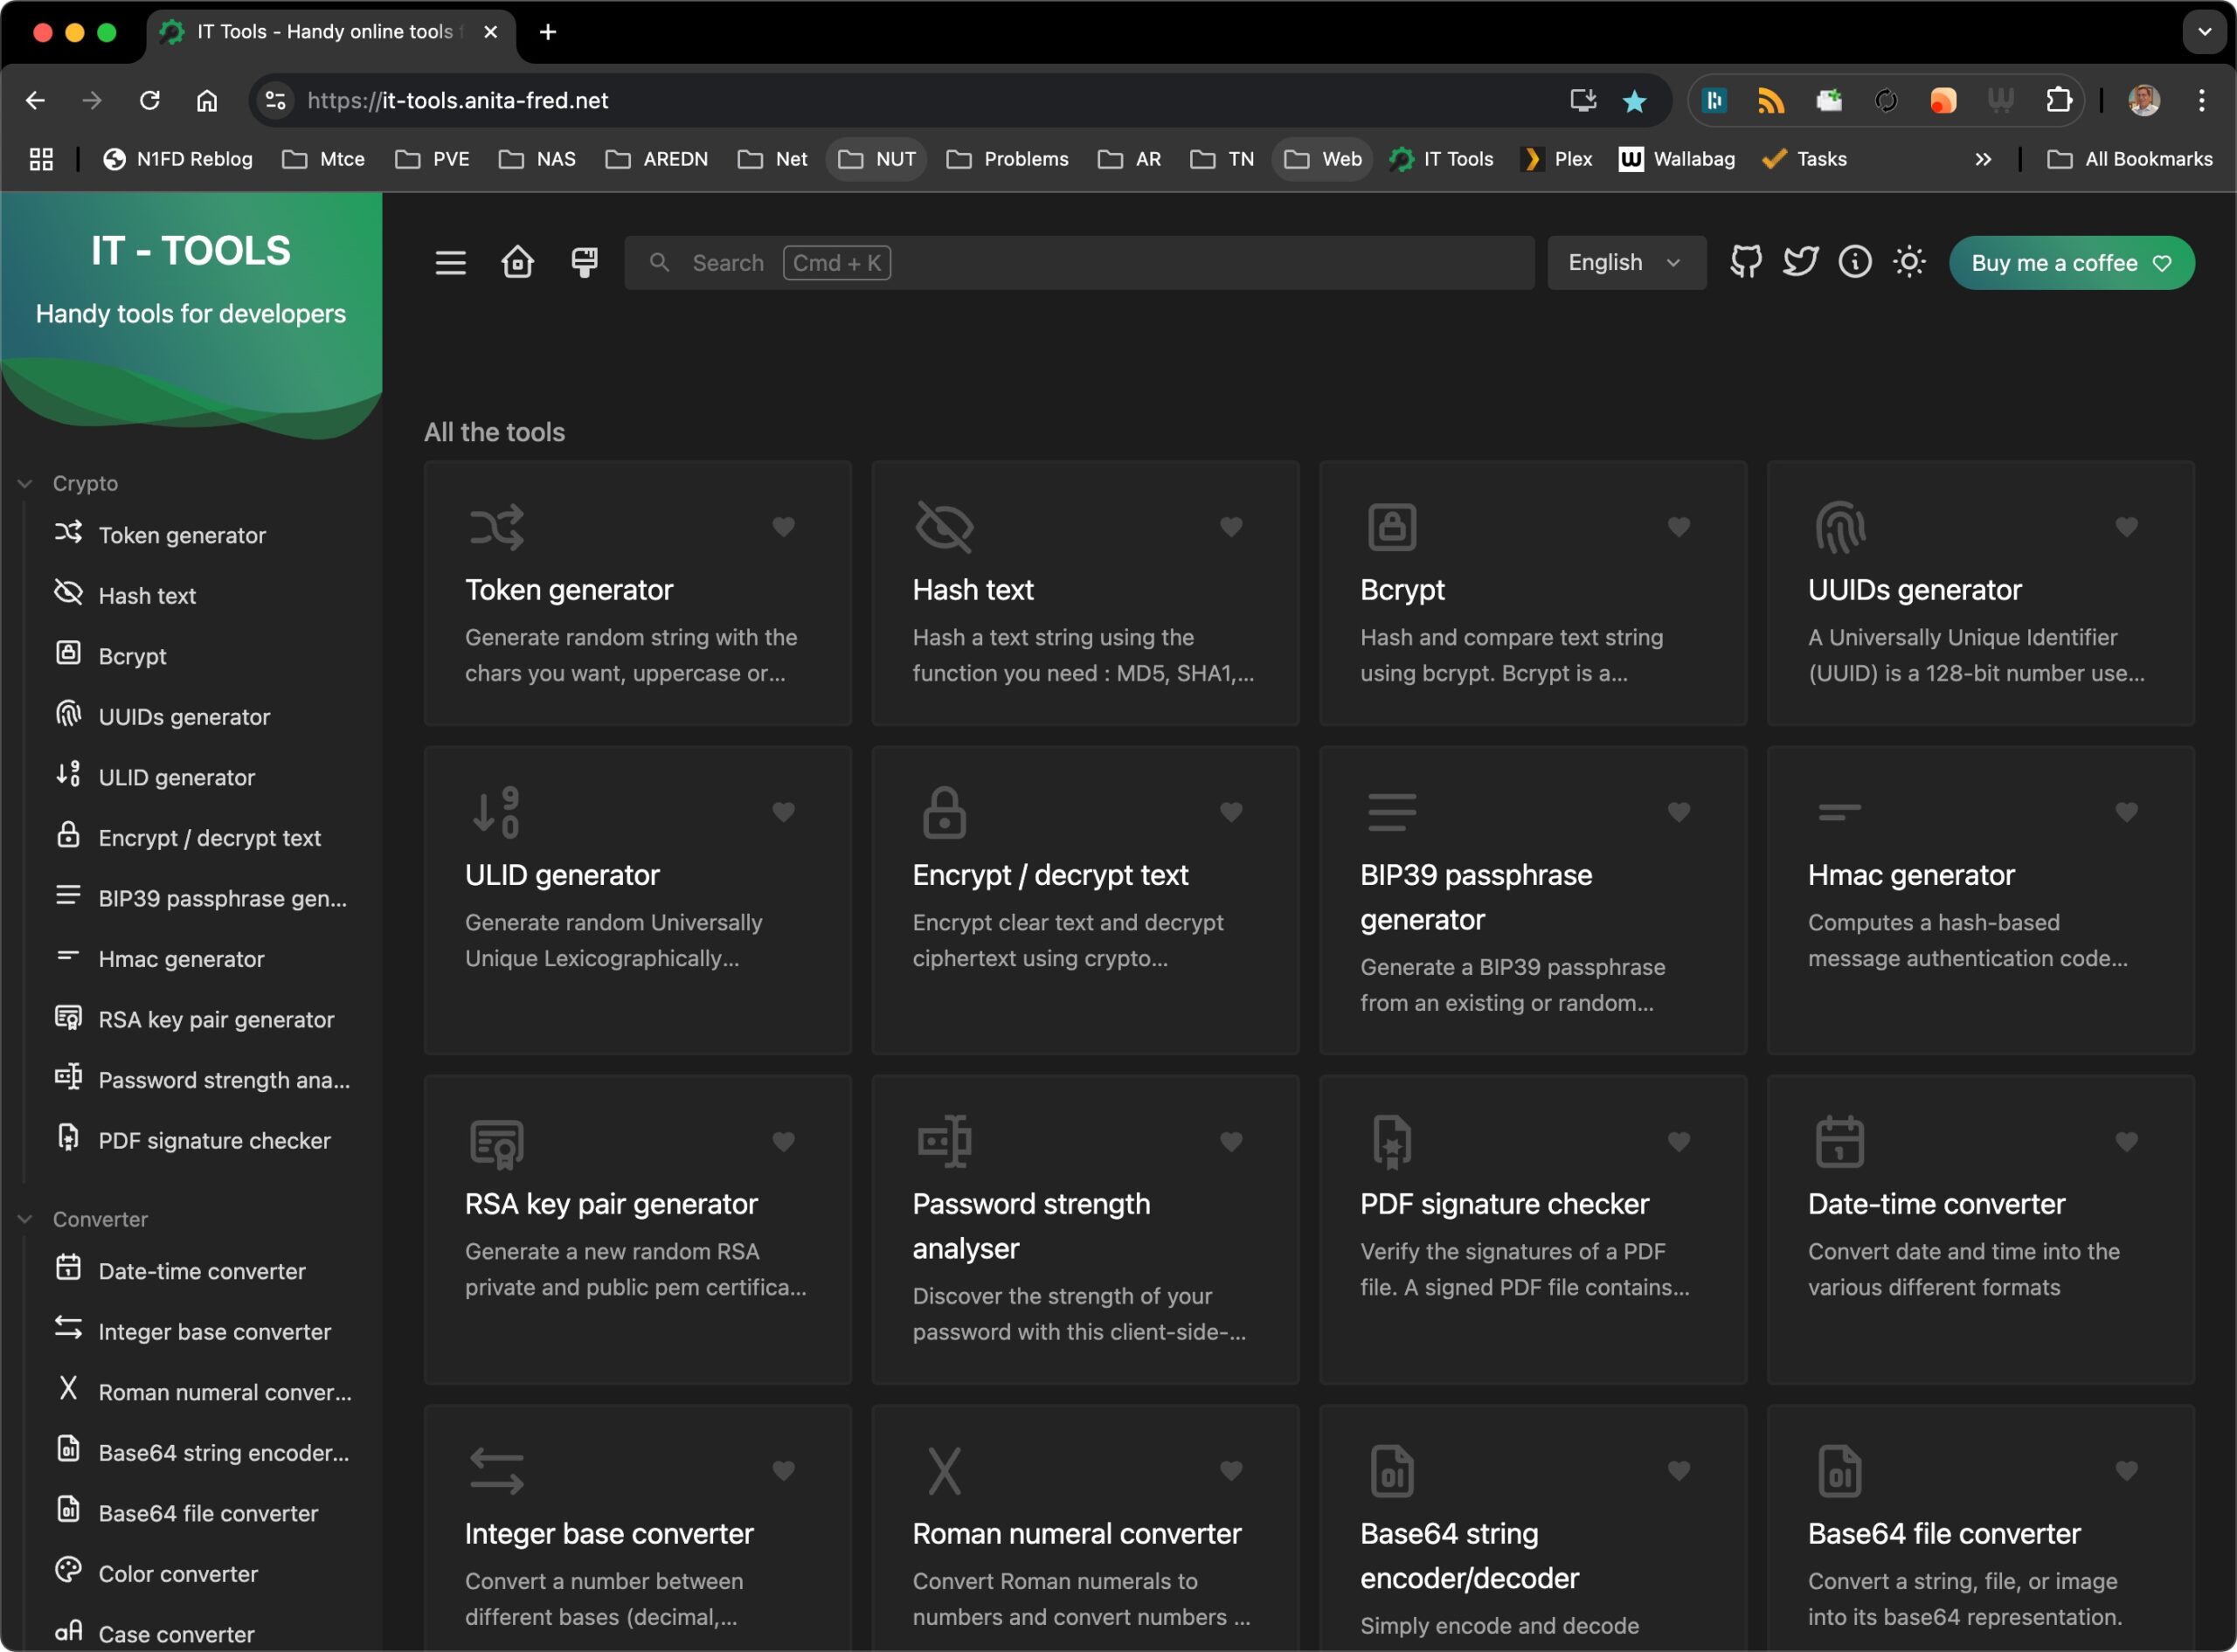
We have found a useful Docker application for Homelab folks. It’s called IT Tools. It can be run as a Docker container. Our installation uses our Traefik reverse proxy.
The video above covers the installation via Docker Compose.

We have found a useful Docker application for Homelab folks. It’s called IT Tools. It can be run as a Docker container. Our installation uses our Traefik reverse proxy.
The video above covers the installation via Docker Compose.
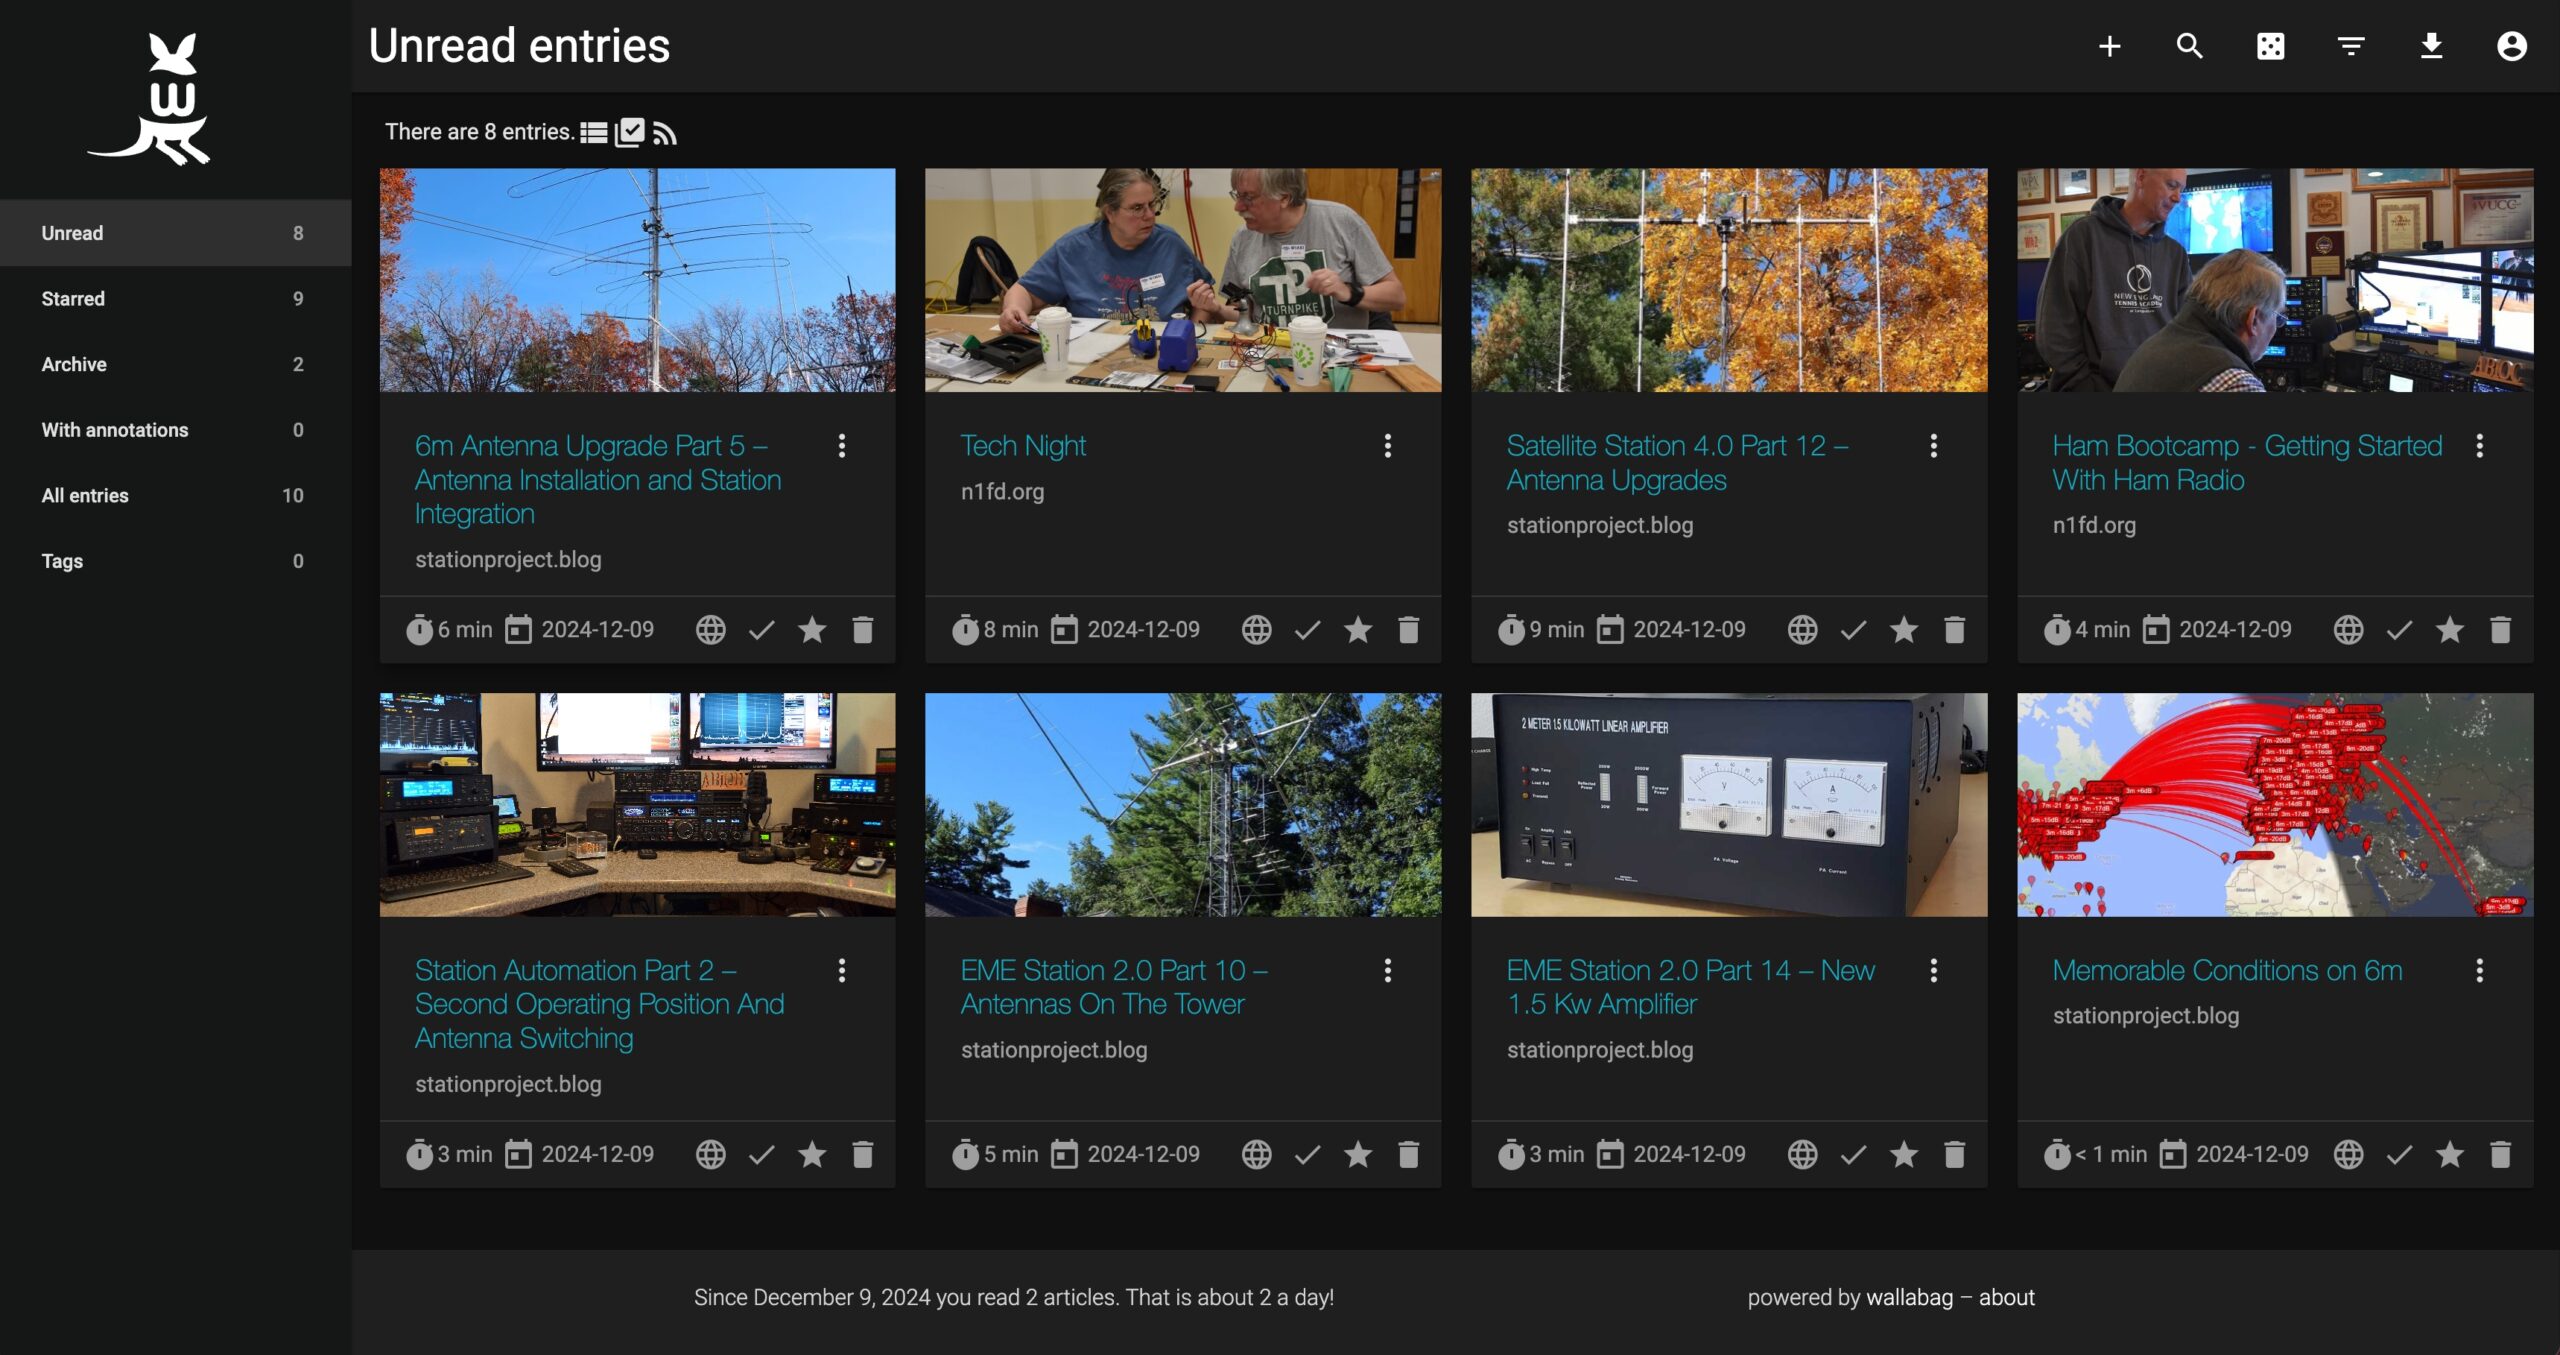
We’re running a Docker container called Wallabag, which can be used to save cleanly formatted copies of web pages and articles. Smartphone (iPhone and Android) apps are available for Wallabag, making viewing the saved content easy on the go.
The following video explains what Wallbag does.
This video covers the installation of Wallabag using Docker Compose. It can run on any docker host.
This video also contains some good information on sources for other self-hosted apps.

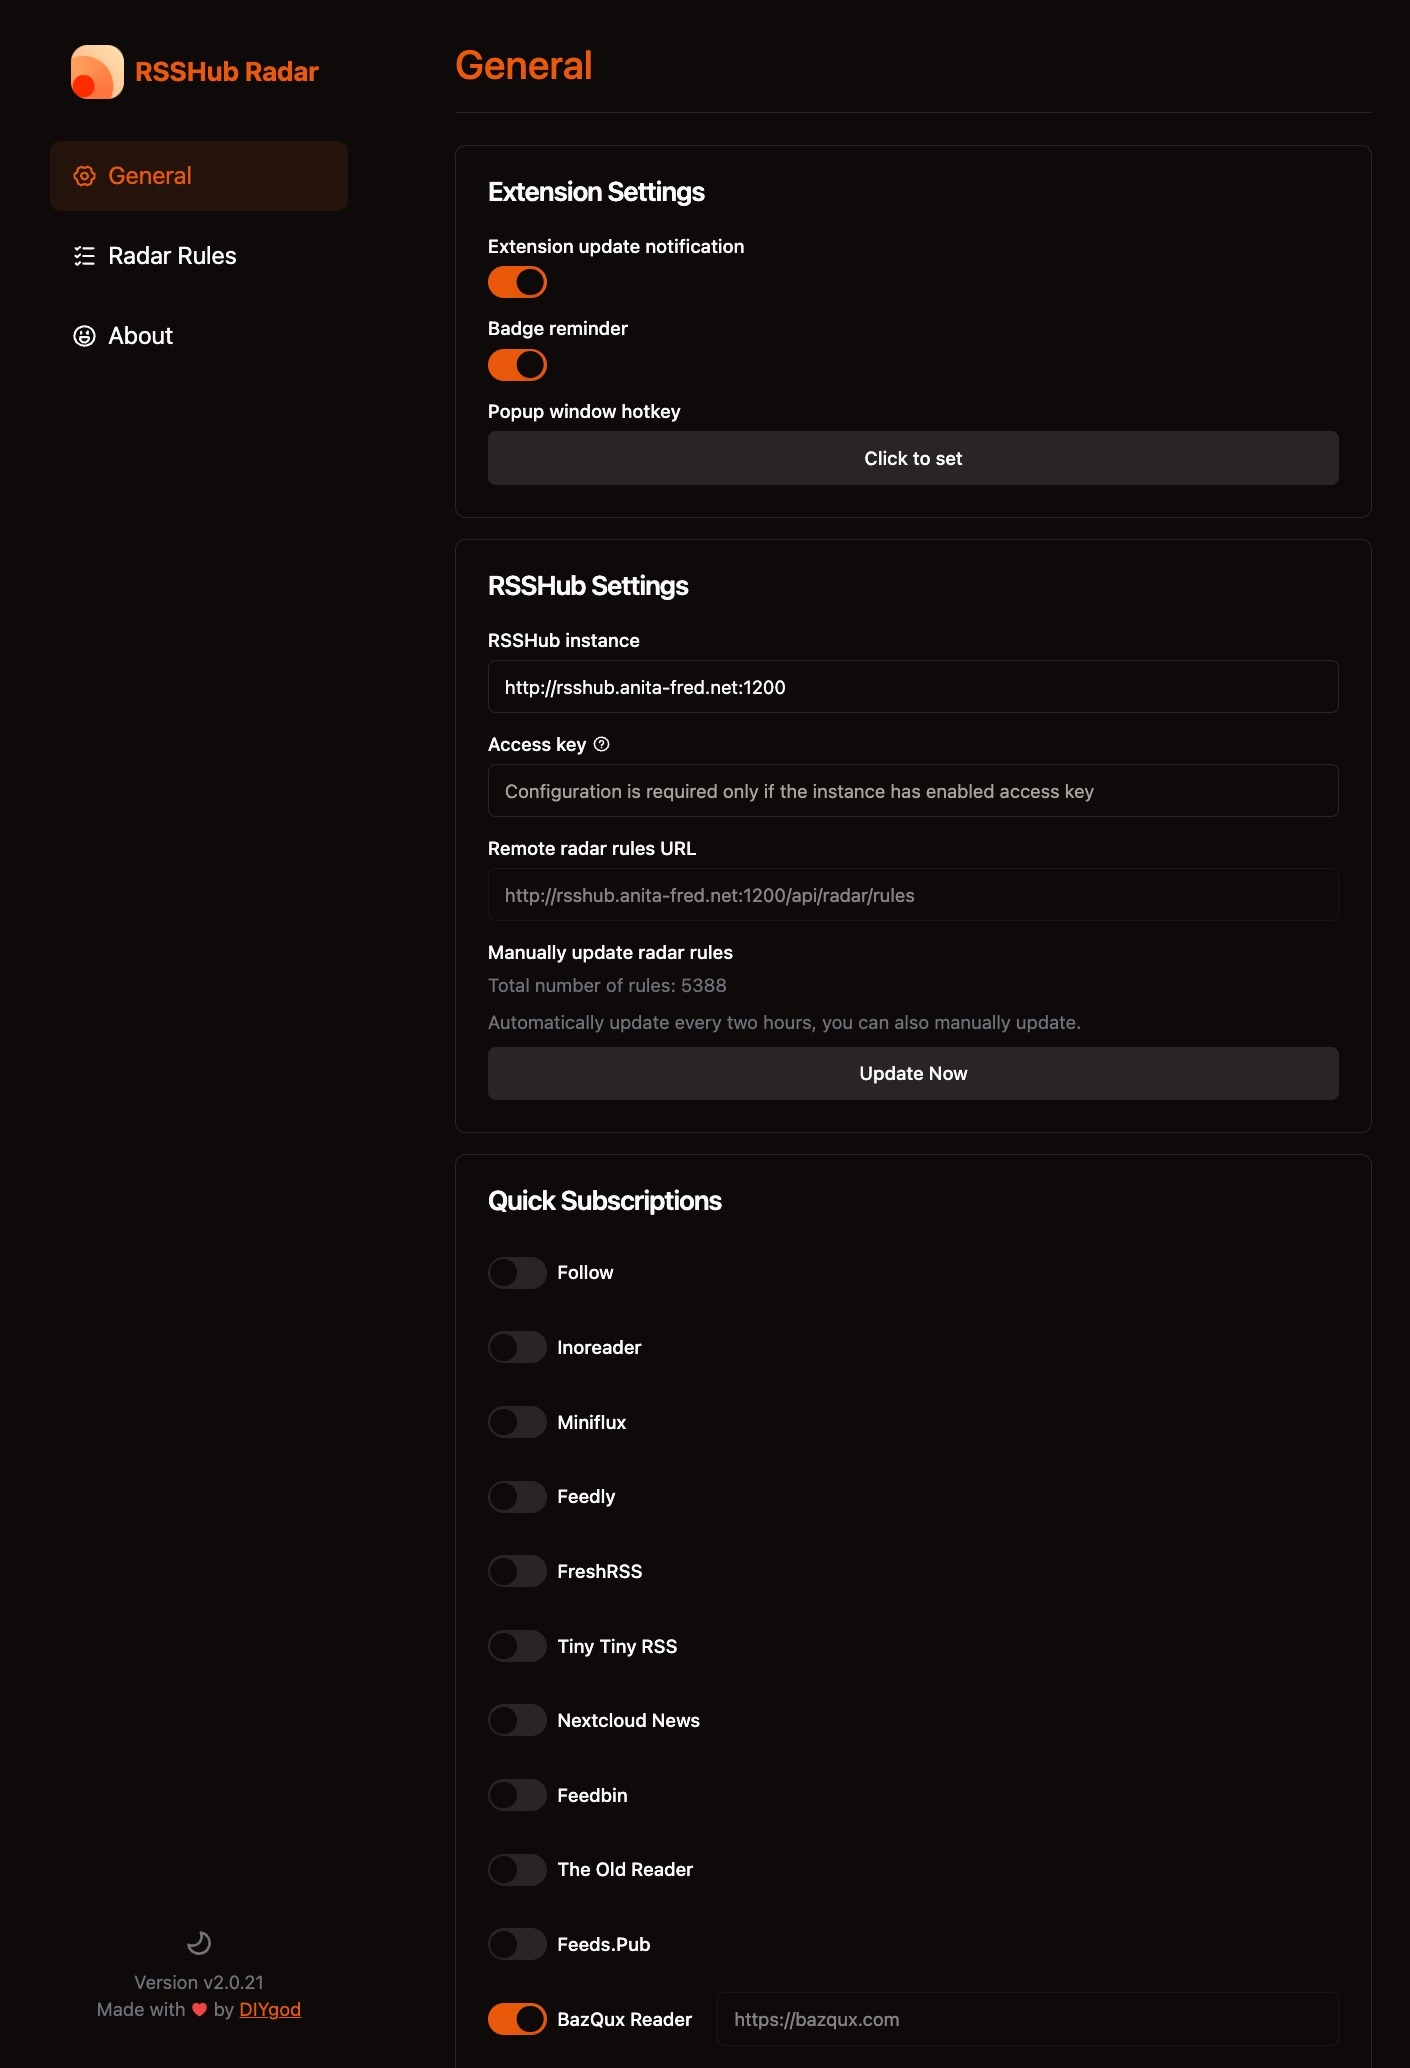
We’re running a Docker container called RSSHub, which detects RSS feeds available on websites that we browse. You can learn more about RSS Hub here.
This page covers the installation and use of the RSSHub container and the associated RSSHub Radar Chrome browser extension.

We use the BazQux RSS Reader with our installation. The following shows our configuration for the RSS Hub Radar Chrome Extension, which is used with RSSHub –
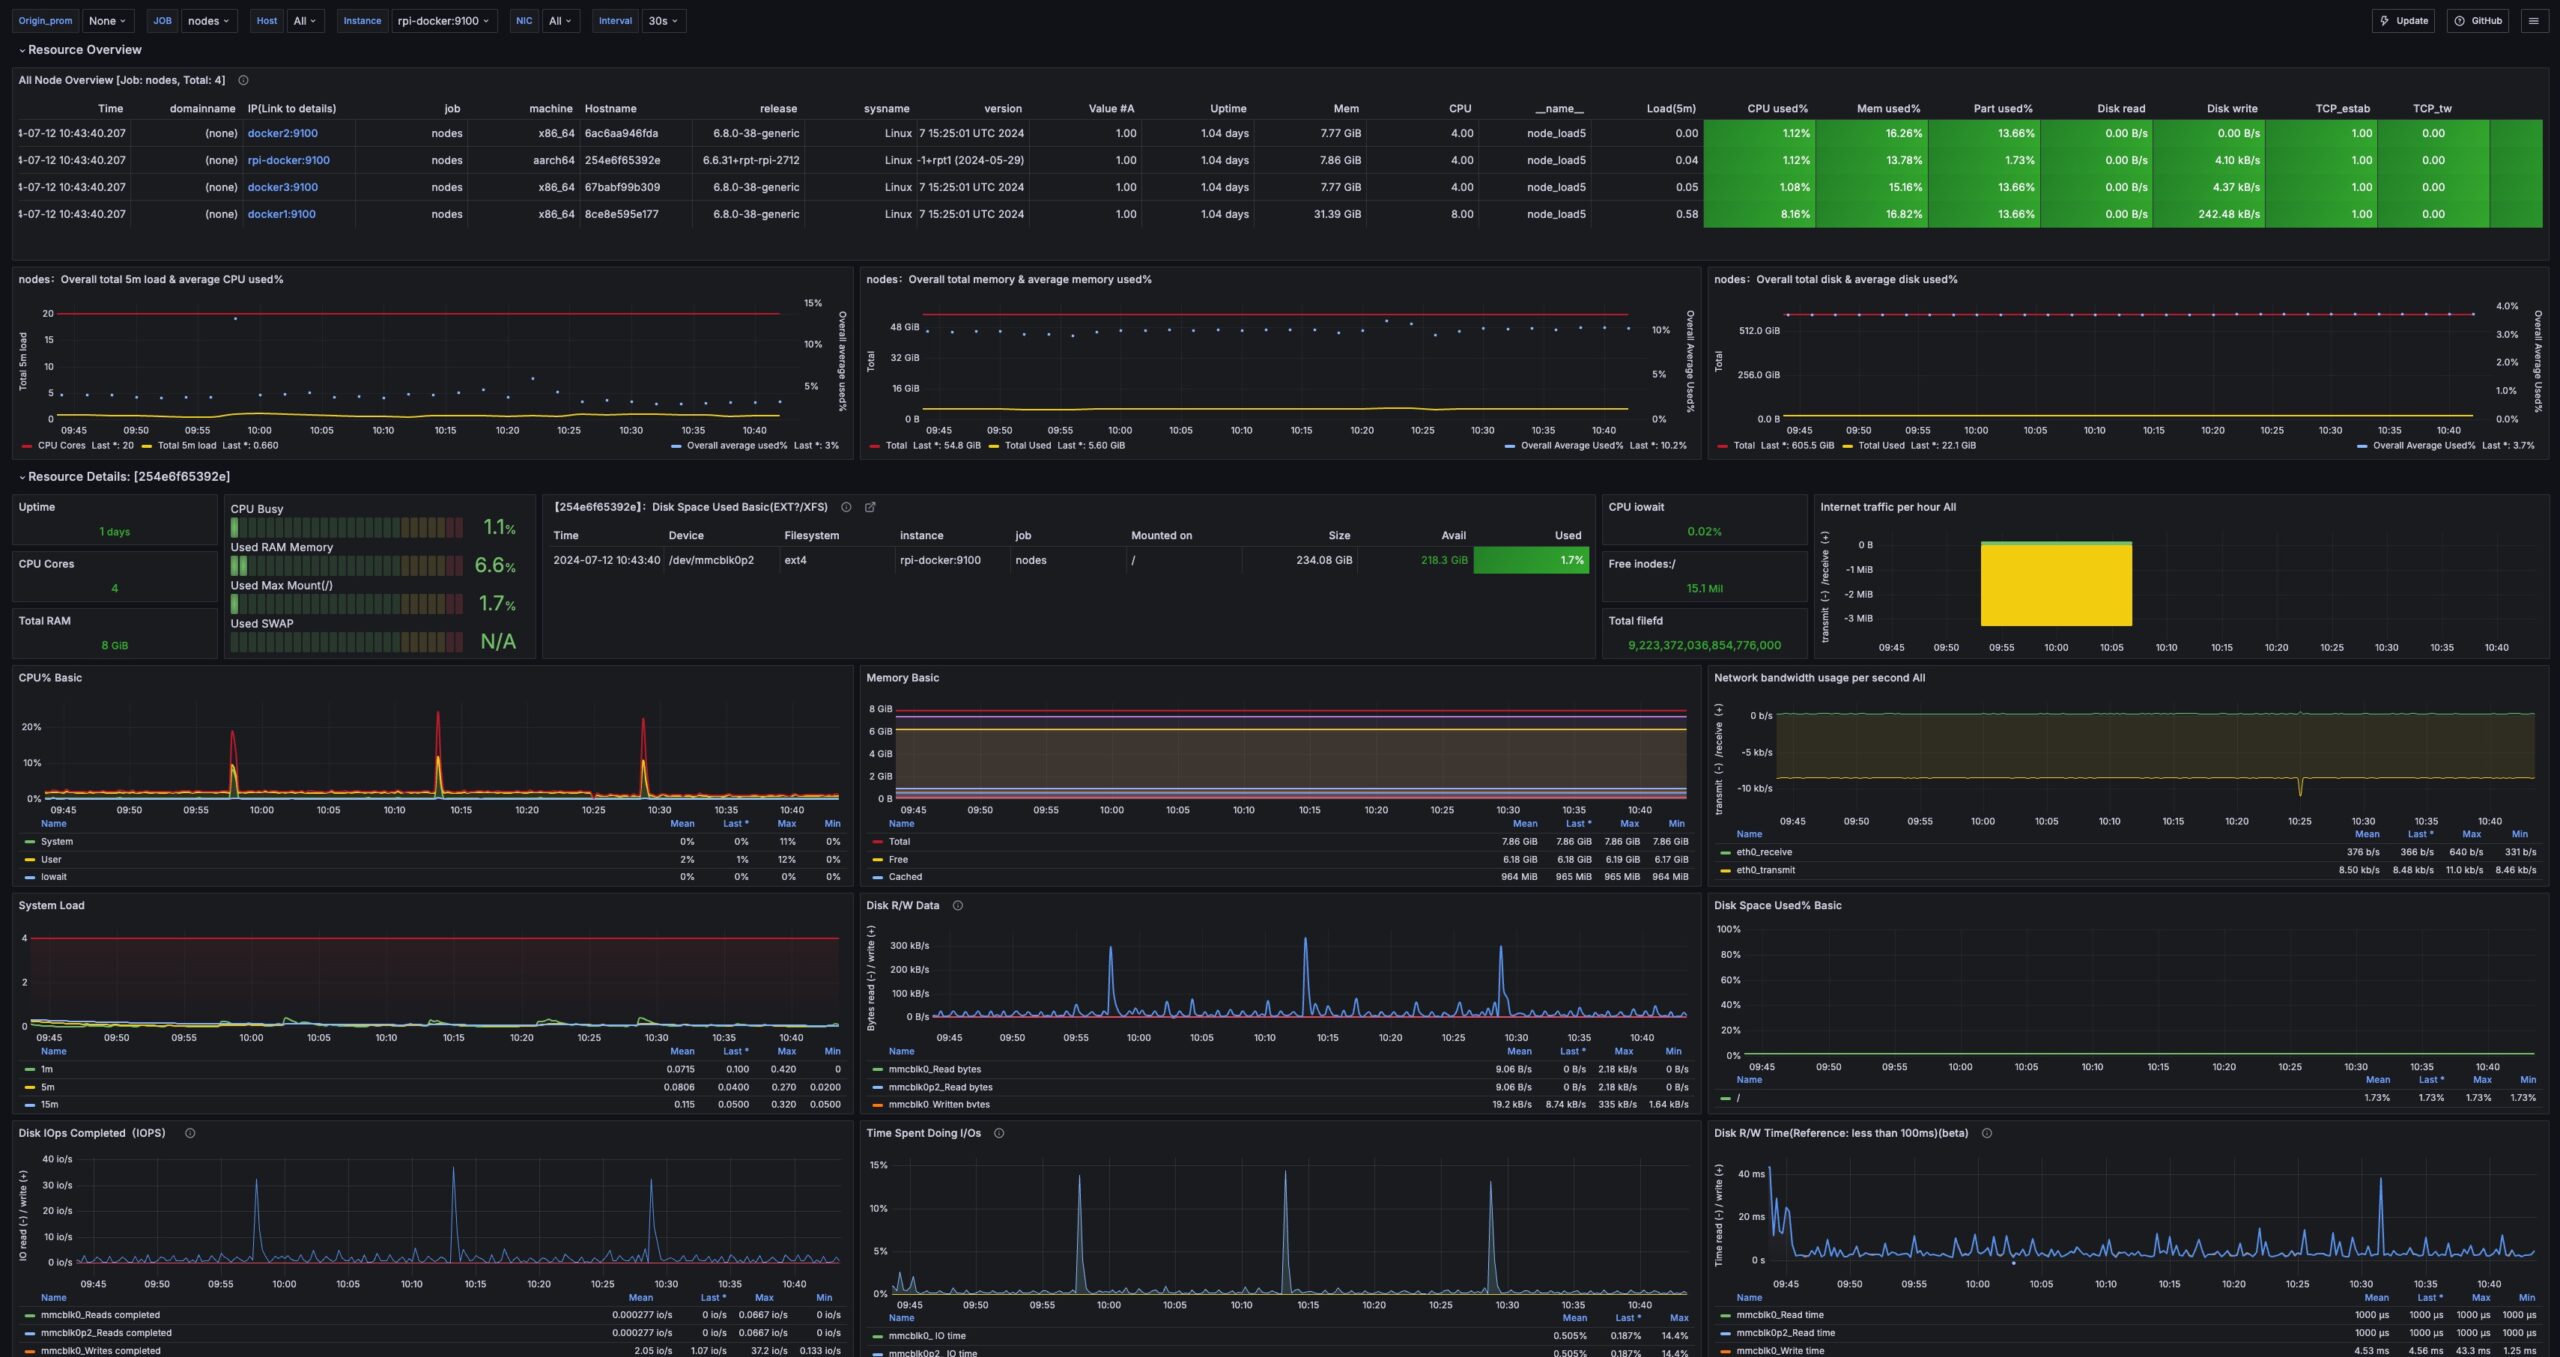
Many of our applications and services run as Docker containers. Our monitoring dashboard solution covers two aspects of Docker container performance:
These data collectors enable several Grafana dashboards that help us manage our Docker cluster.
We run a combination of Node Exporter and cAdvisor on each Docker host VMs. These containers scrape data for our Docker hosts and feed it to the Prometheus instance in our Docker stack.
The following video explains how all of this is set up –
We are using several dashboards to implement our Docker monitoring solution.
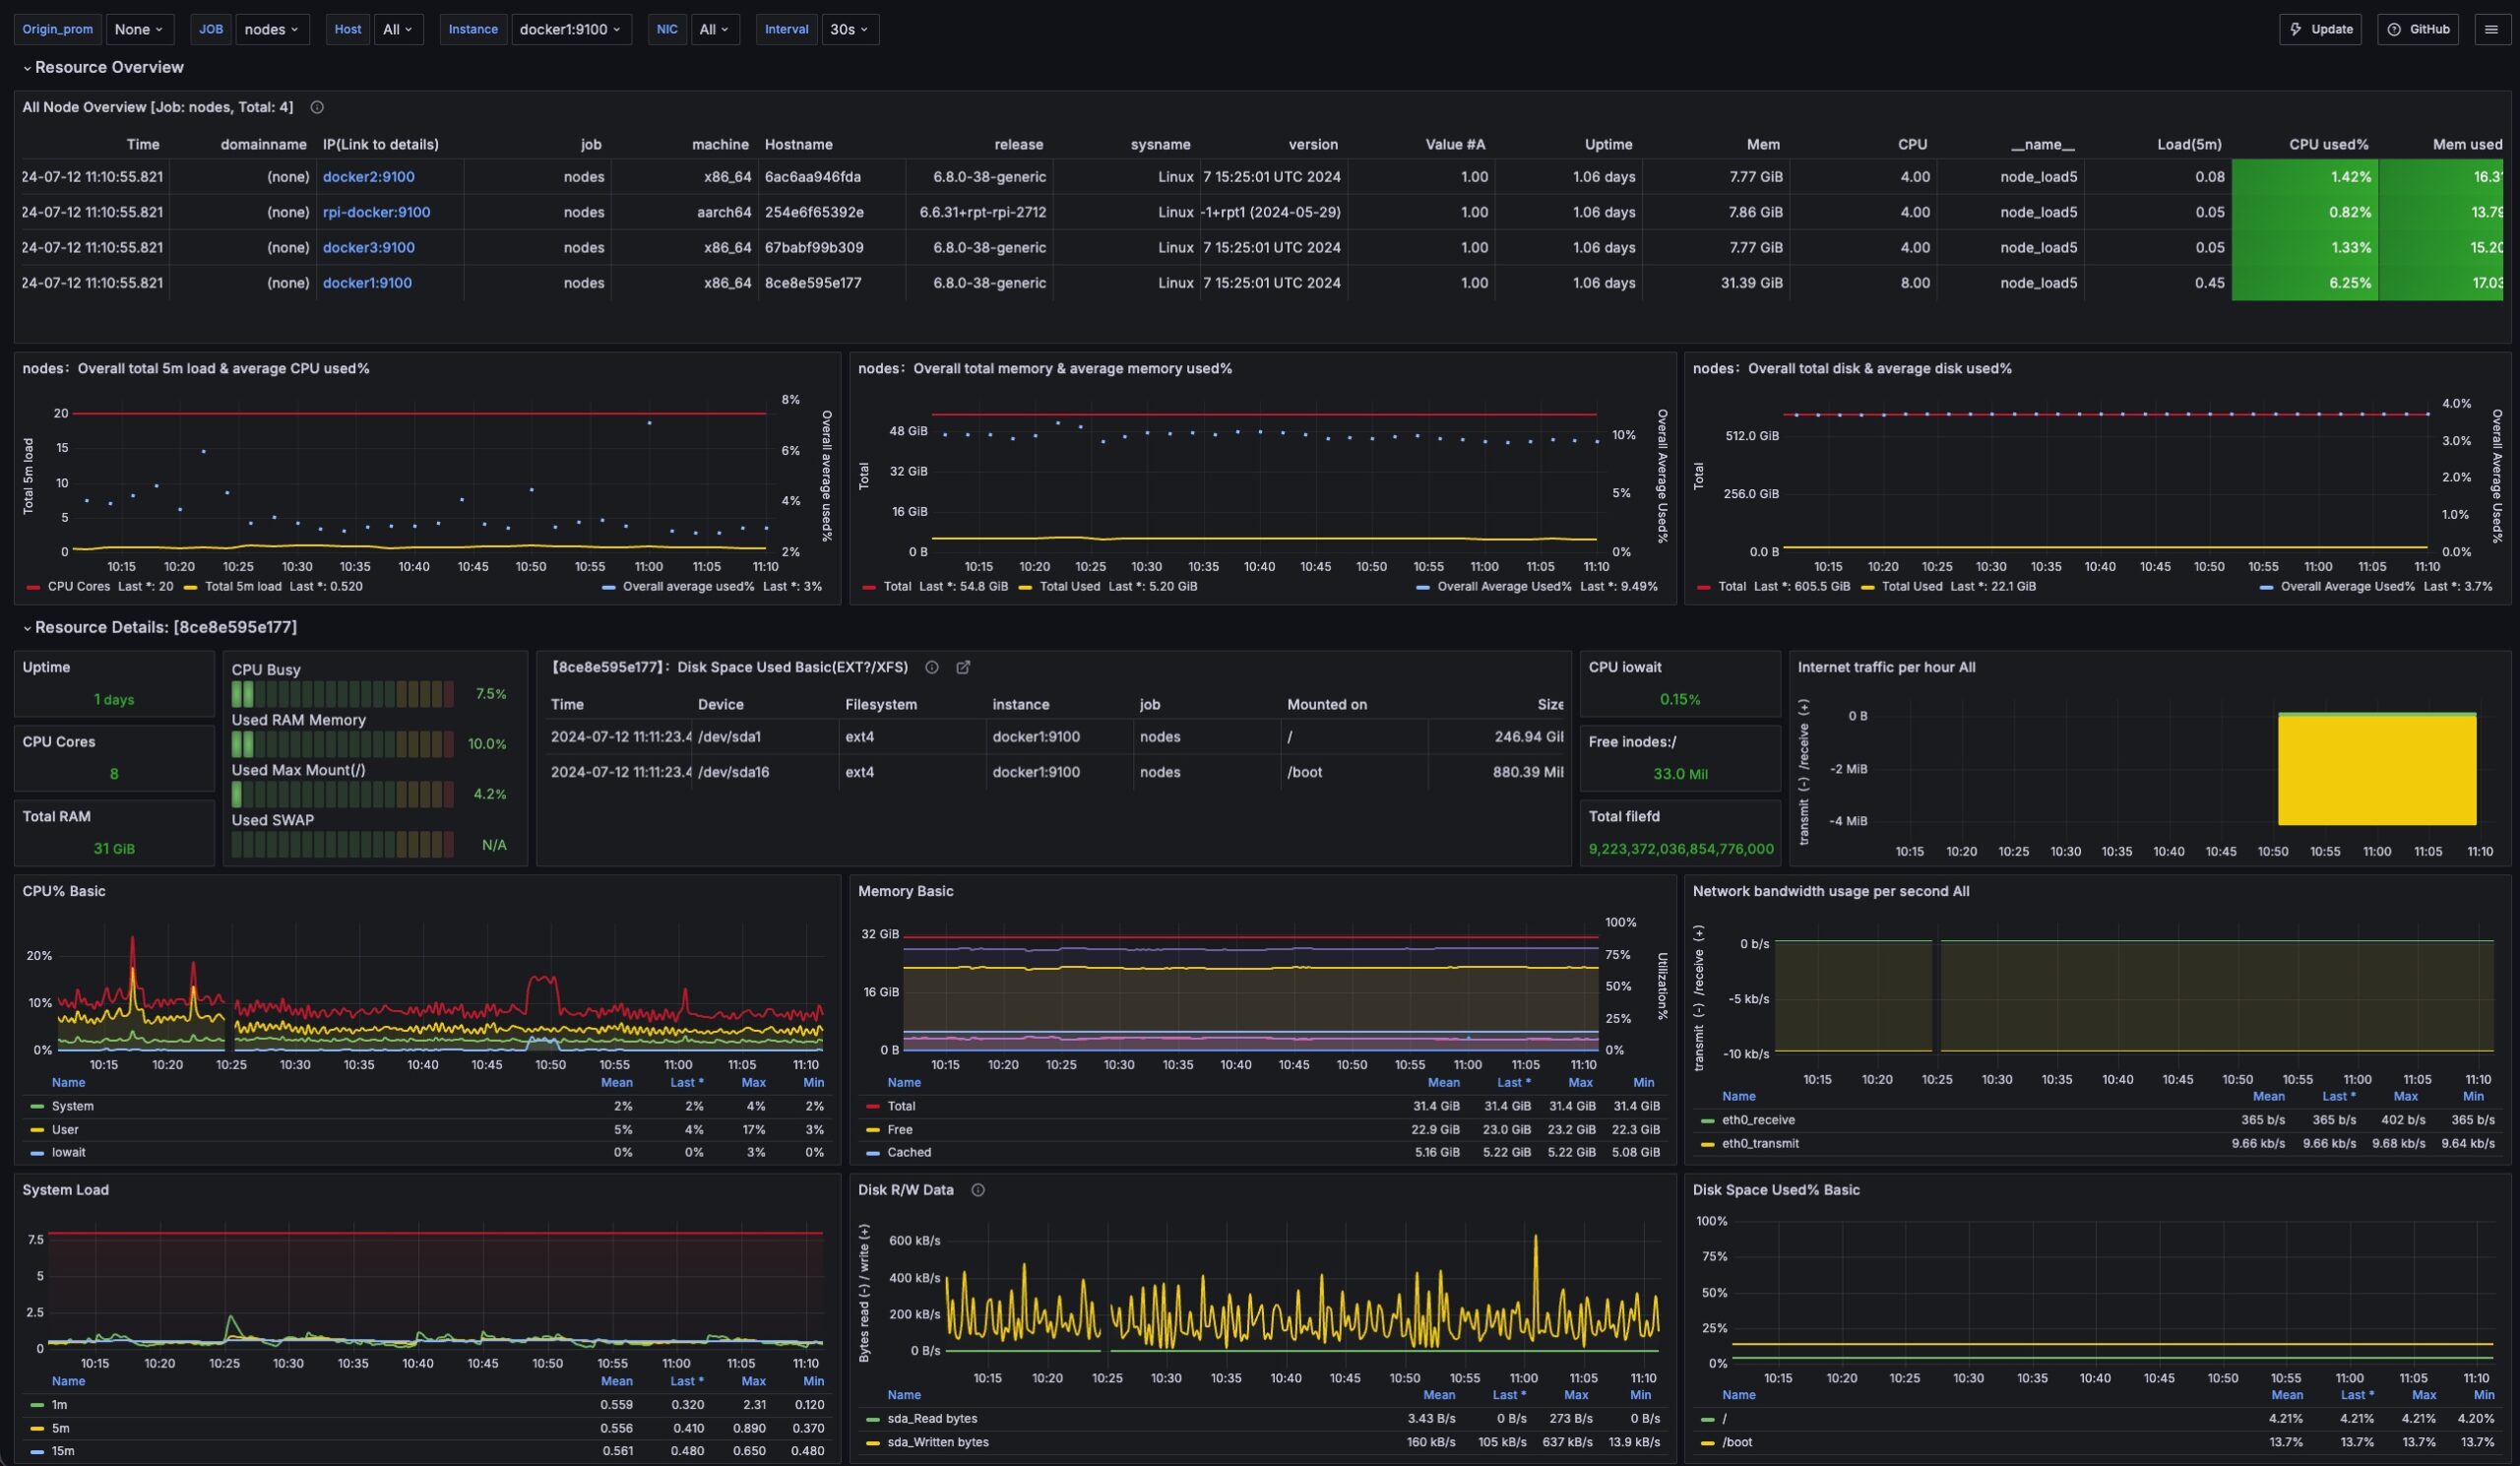
We are using a modified version of the Grafana Dashboard above to monitor the overall performance of our Docker nodes.
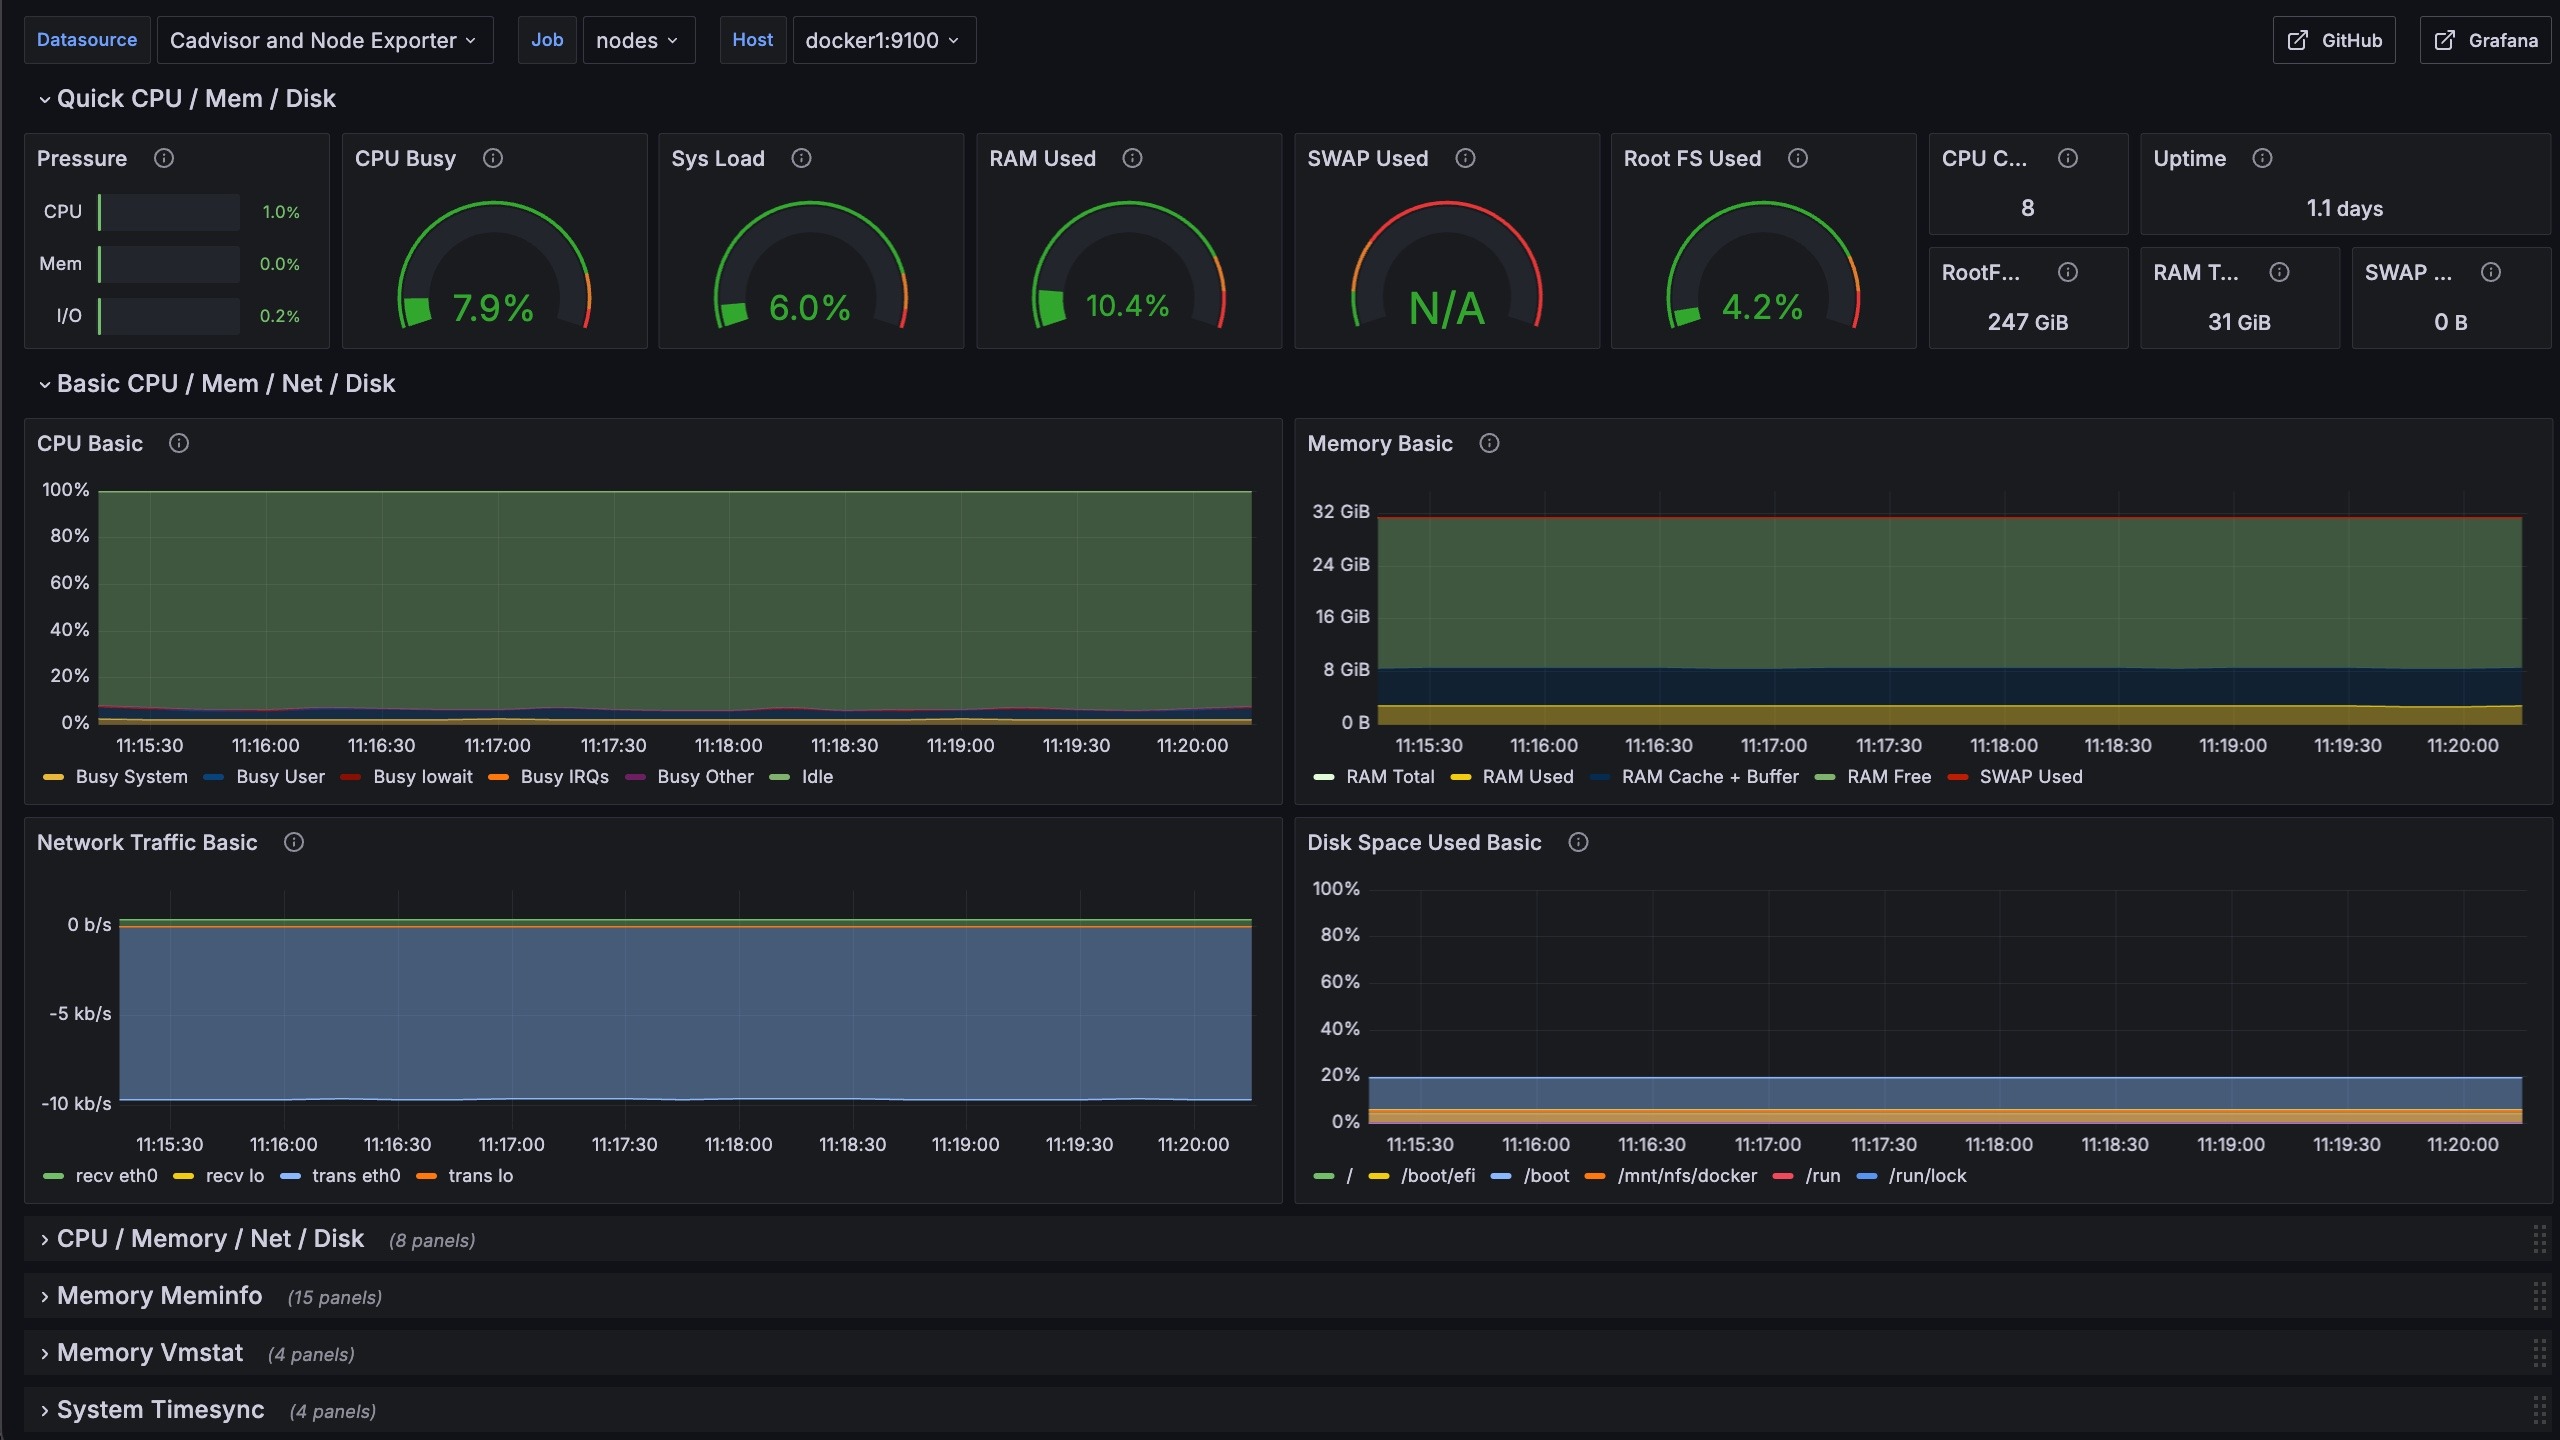
We are using a modified version of the Grafana Dashboard above to monitor and enable drilling into detailed performance metrics for our Docker nodes.
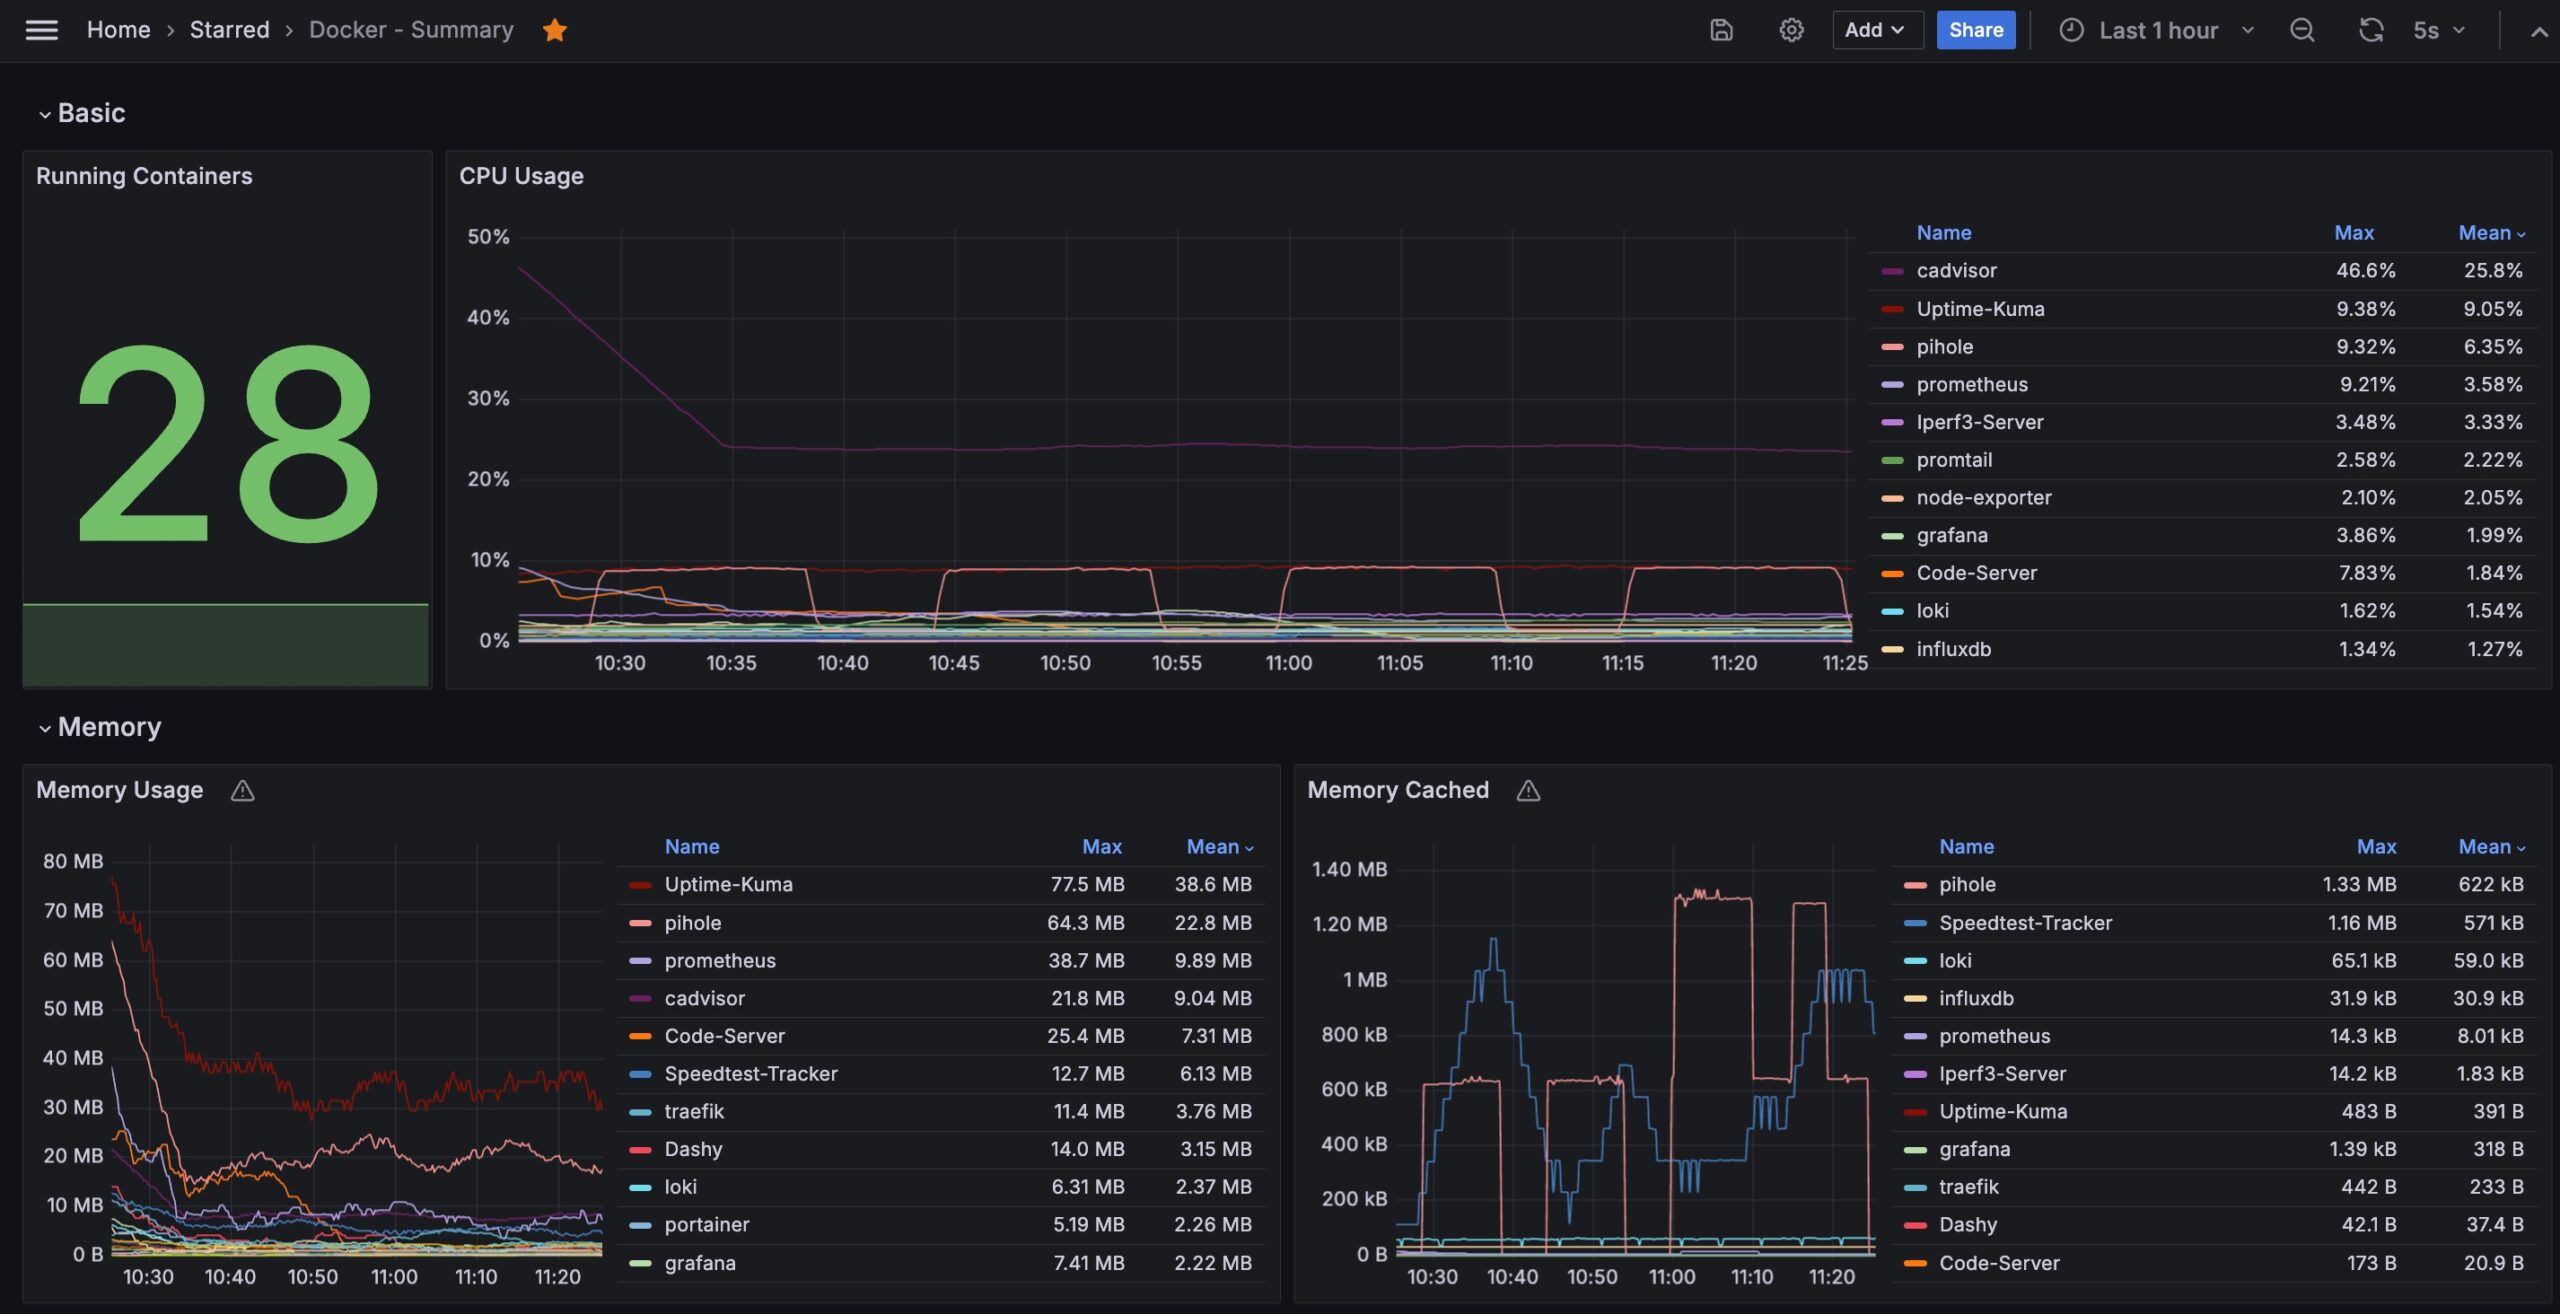
We are using a modified version of the Grafana Dashboard above to monitor and enable a summary view of the containers in our Docker cluster.
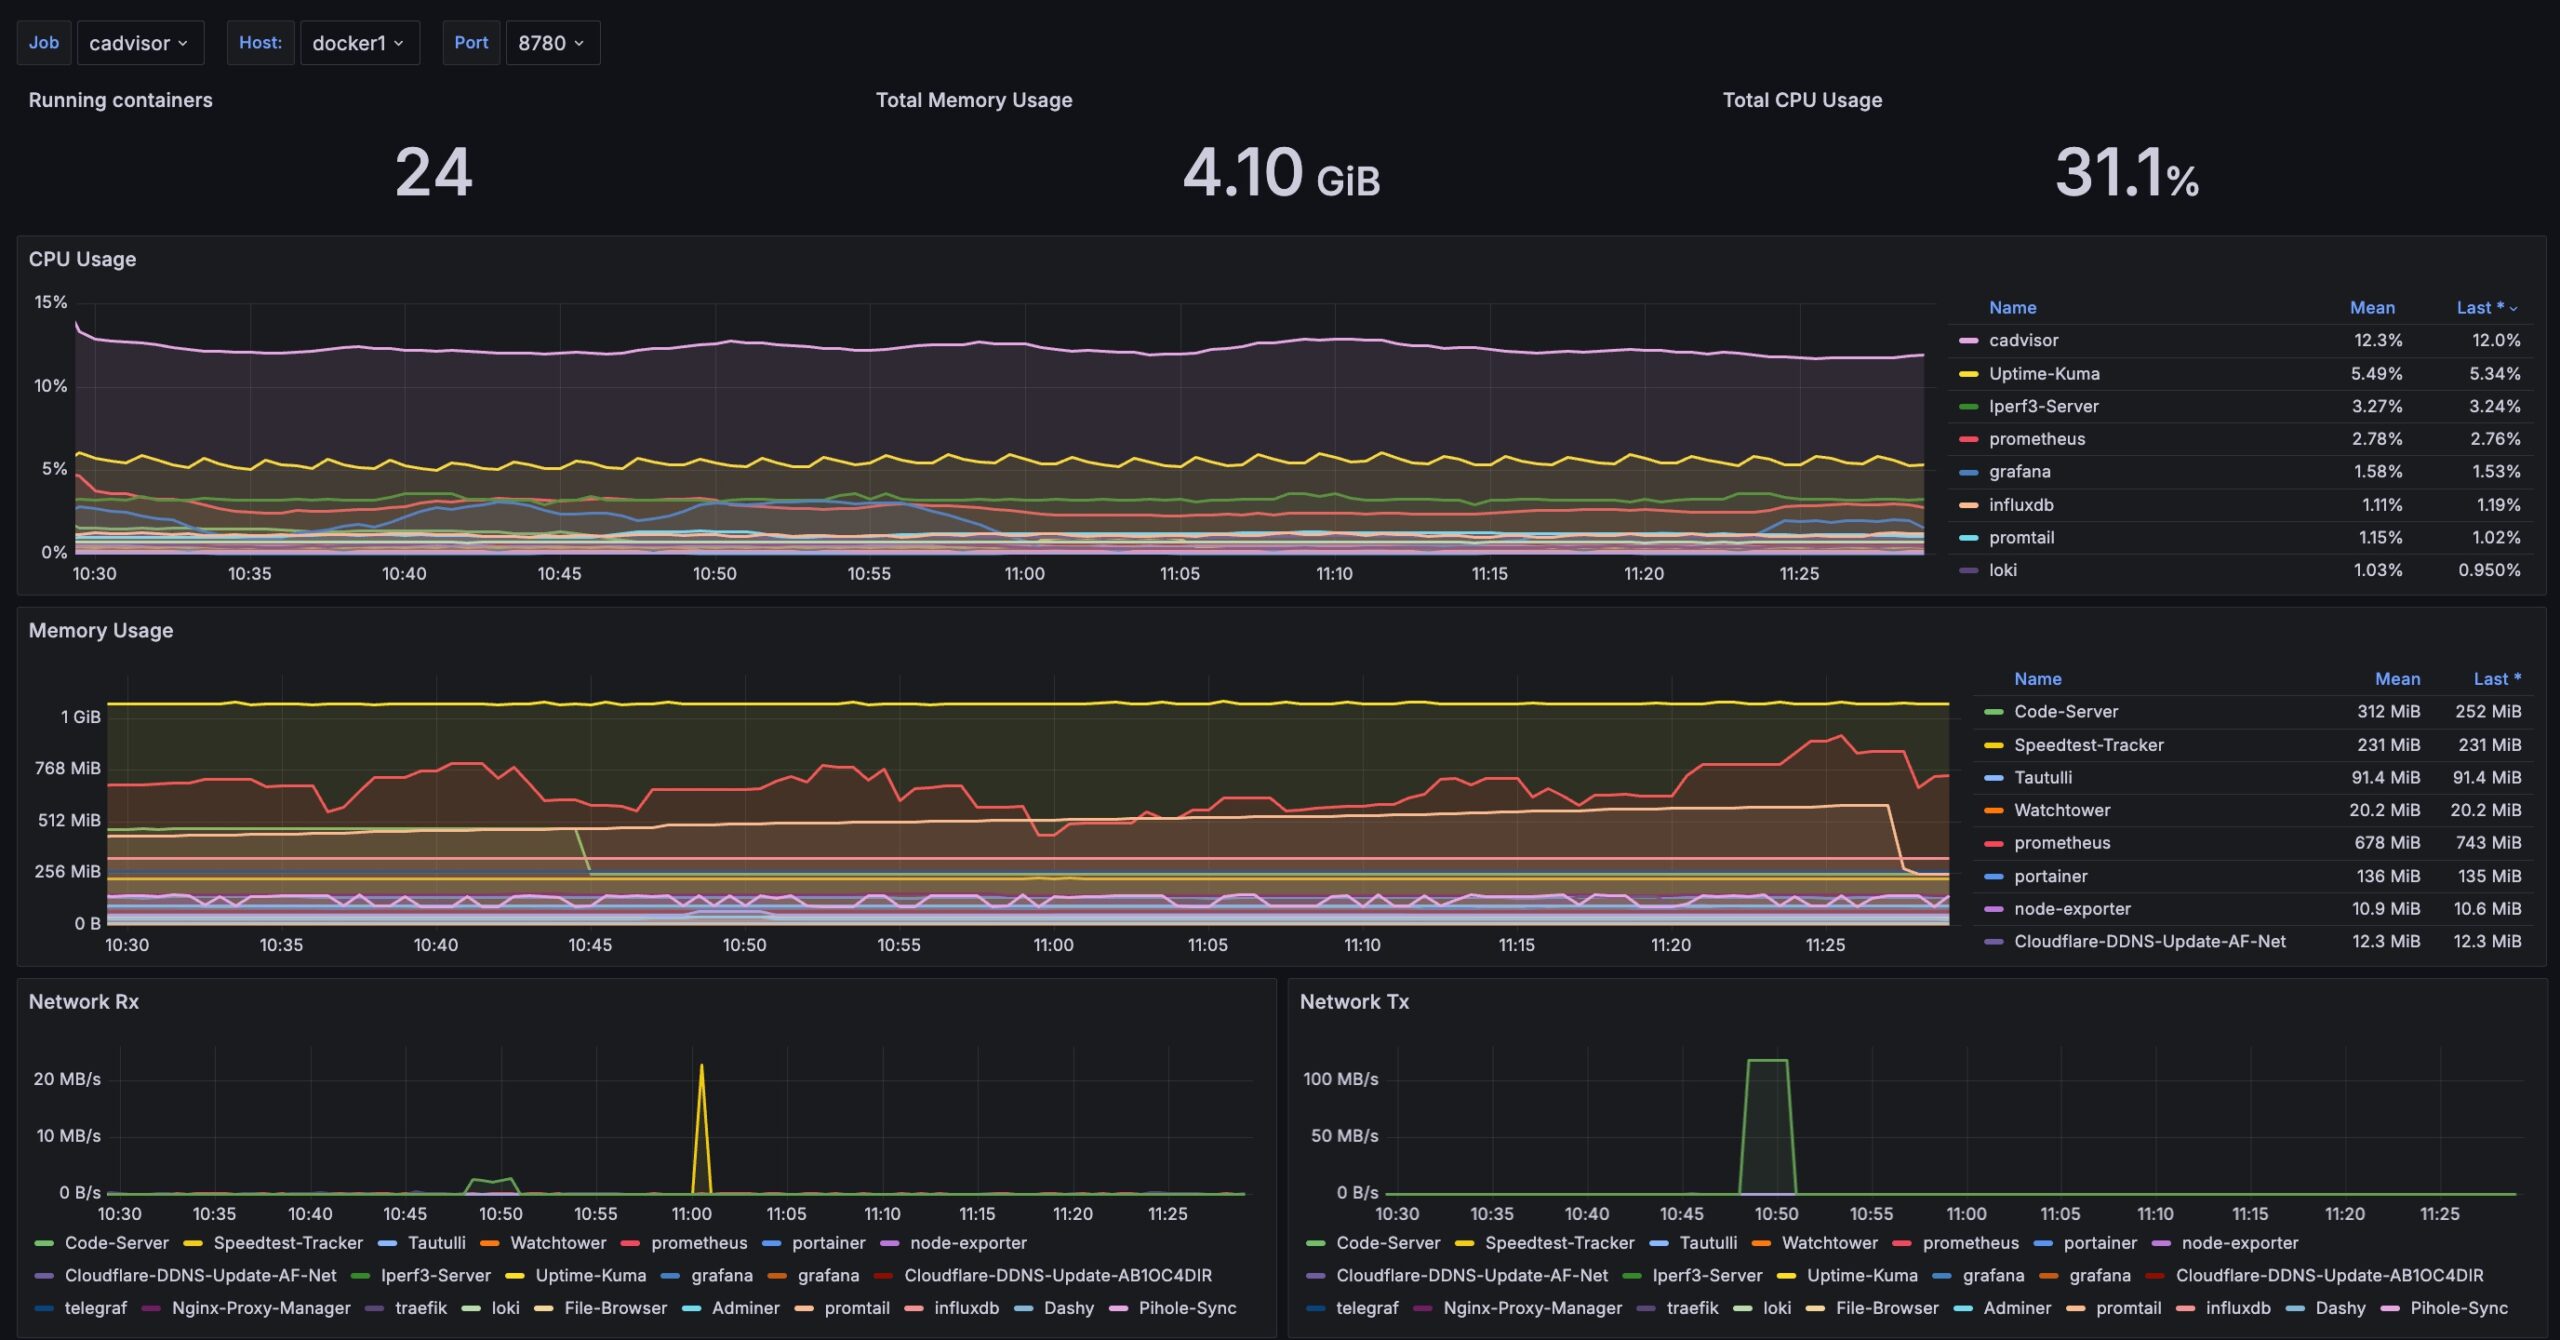
We are using a modified version of the Grafana Dashboard above to monitor and enable drilling into the detailed performance of containers in our Docker cluster.
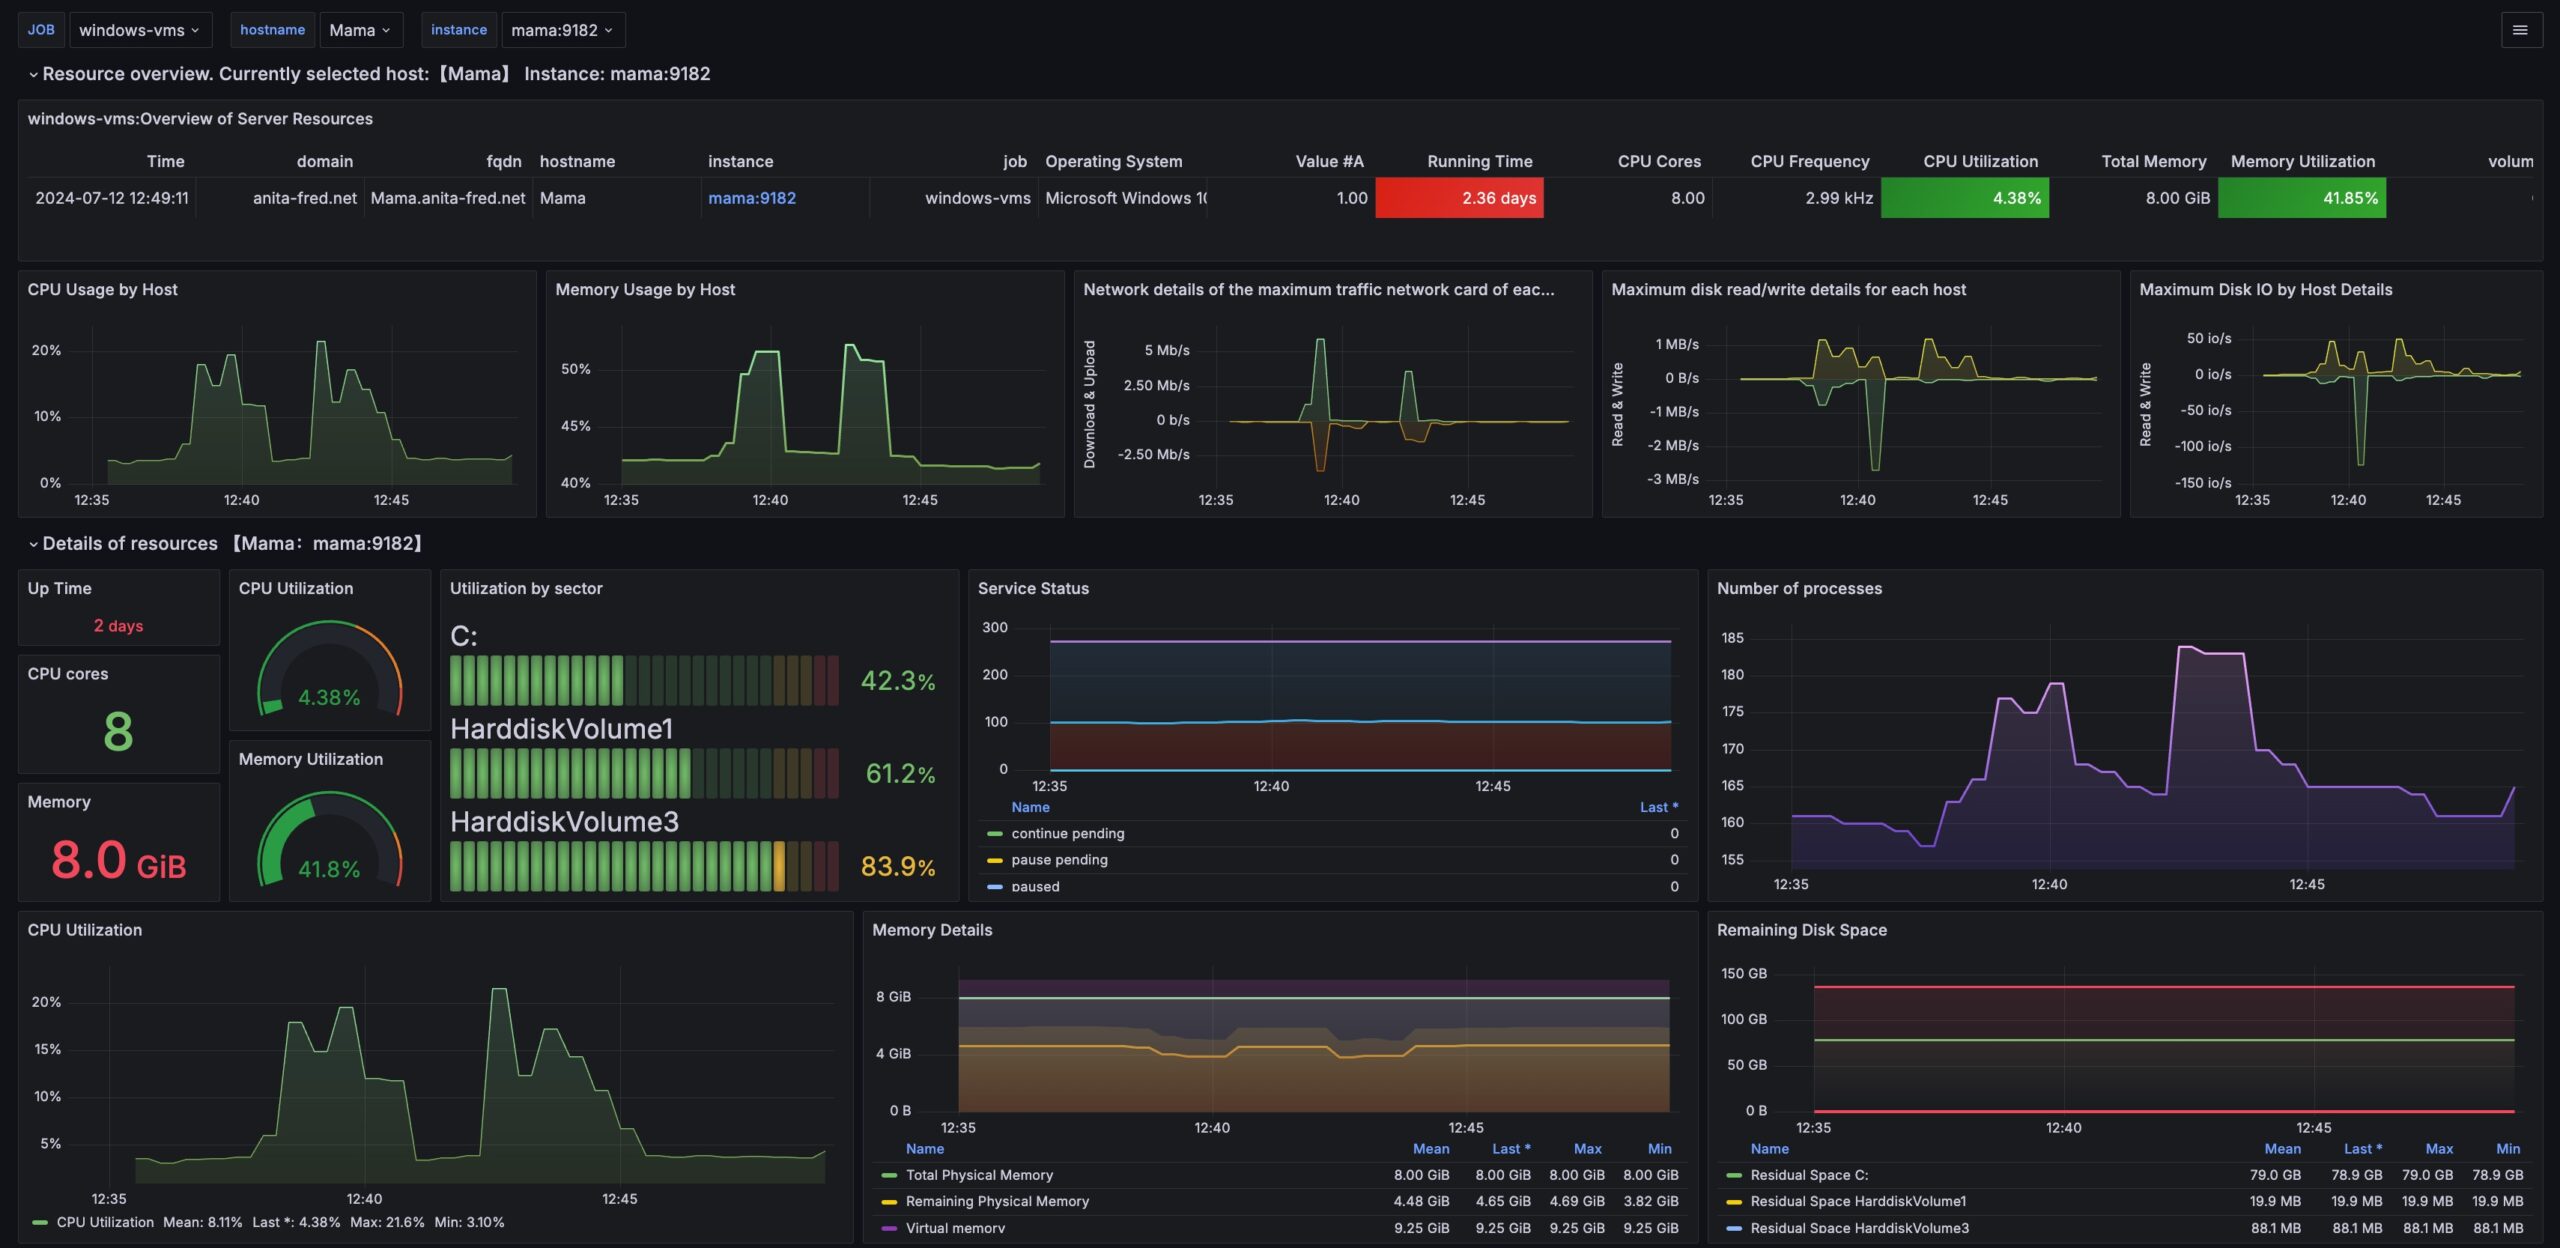
We are using a modified version of the Grafana Dashboard above to monitor and enable drilling into the performance of Windows VMs in our Docker cluster.