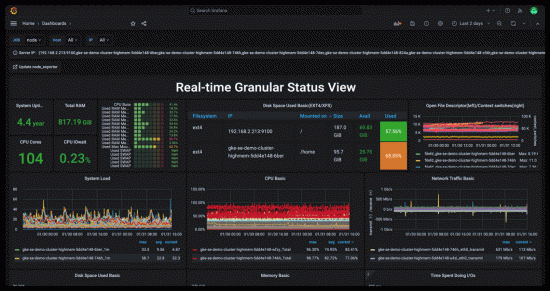
These data collectors enable several Grafana dashboards that help us manage our Docker cluster.
Monitoring Setup
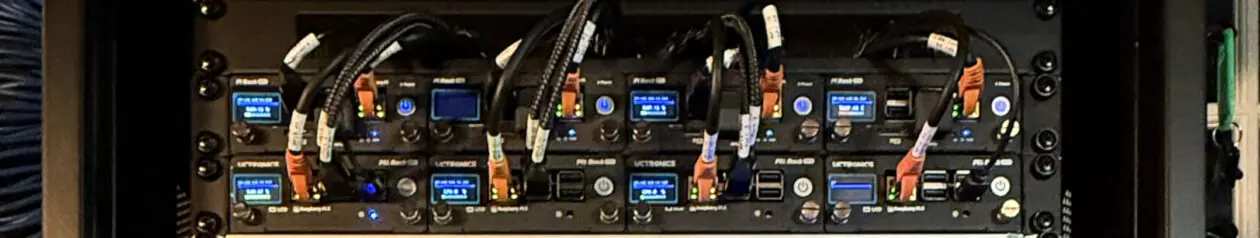
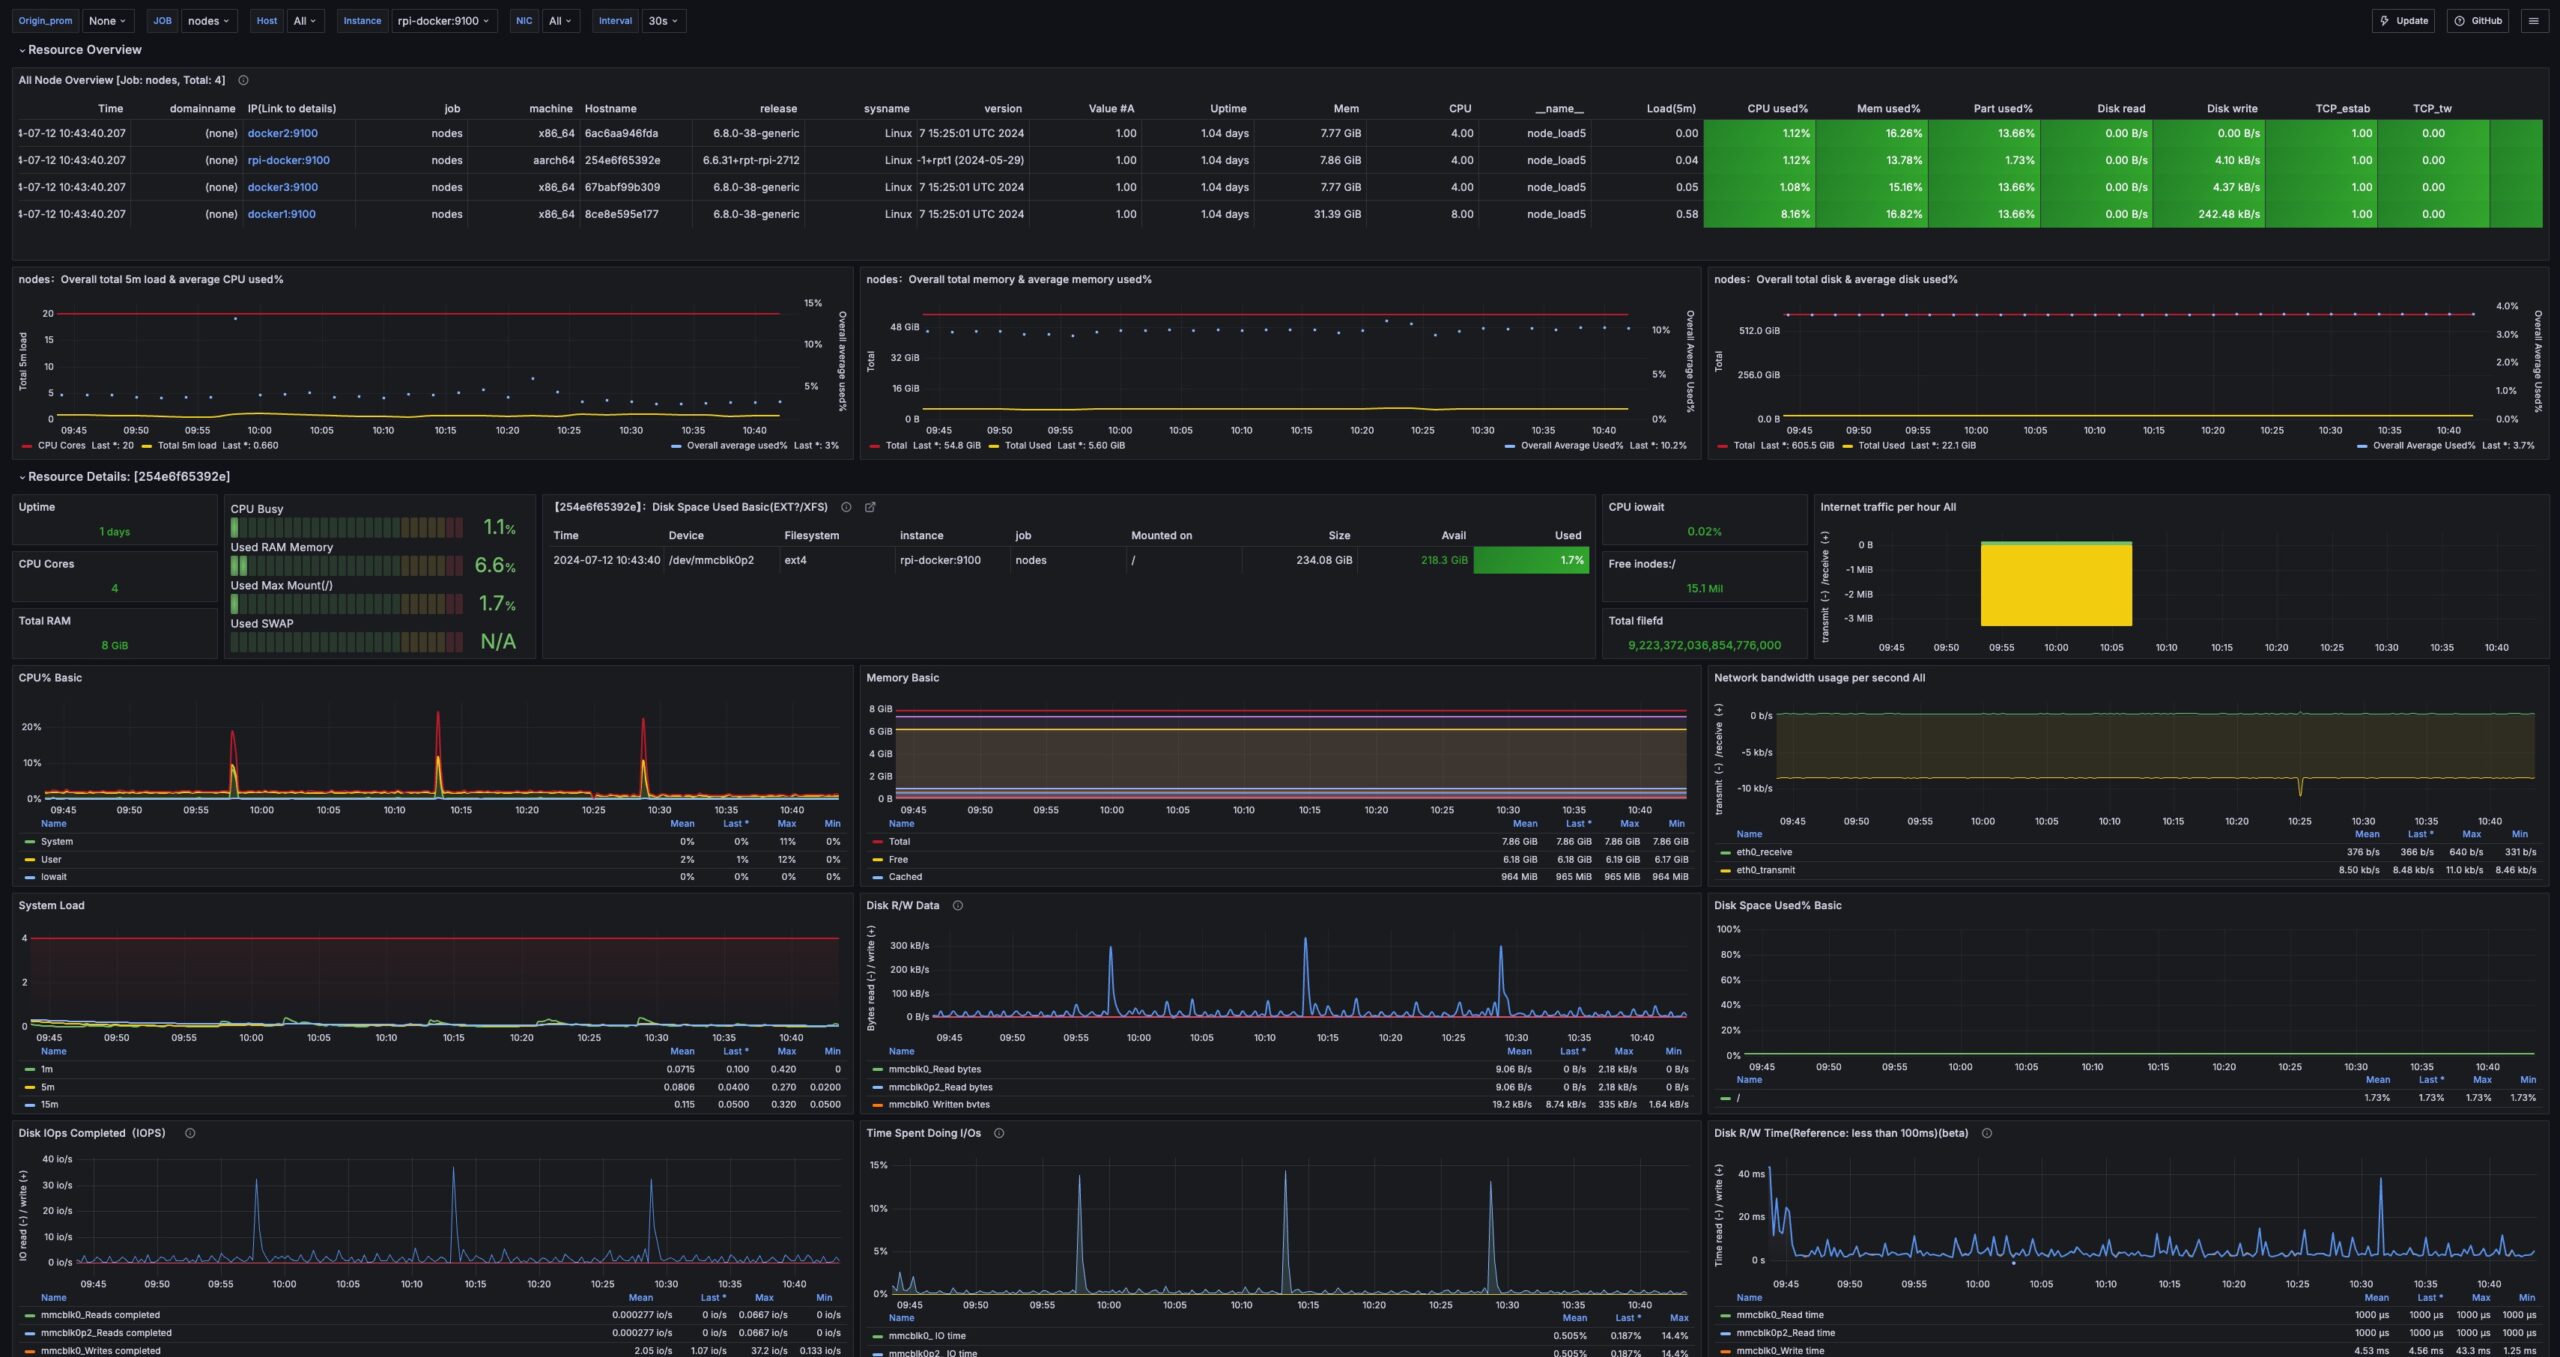
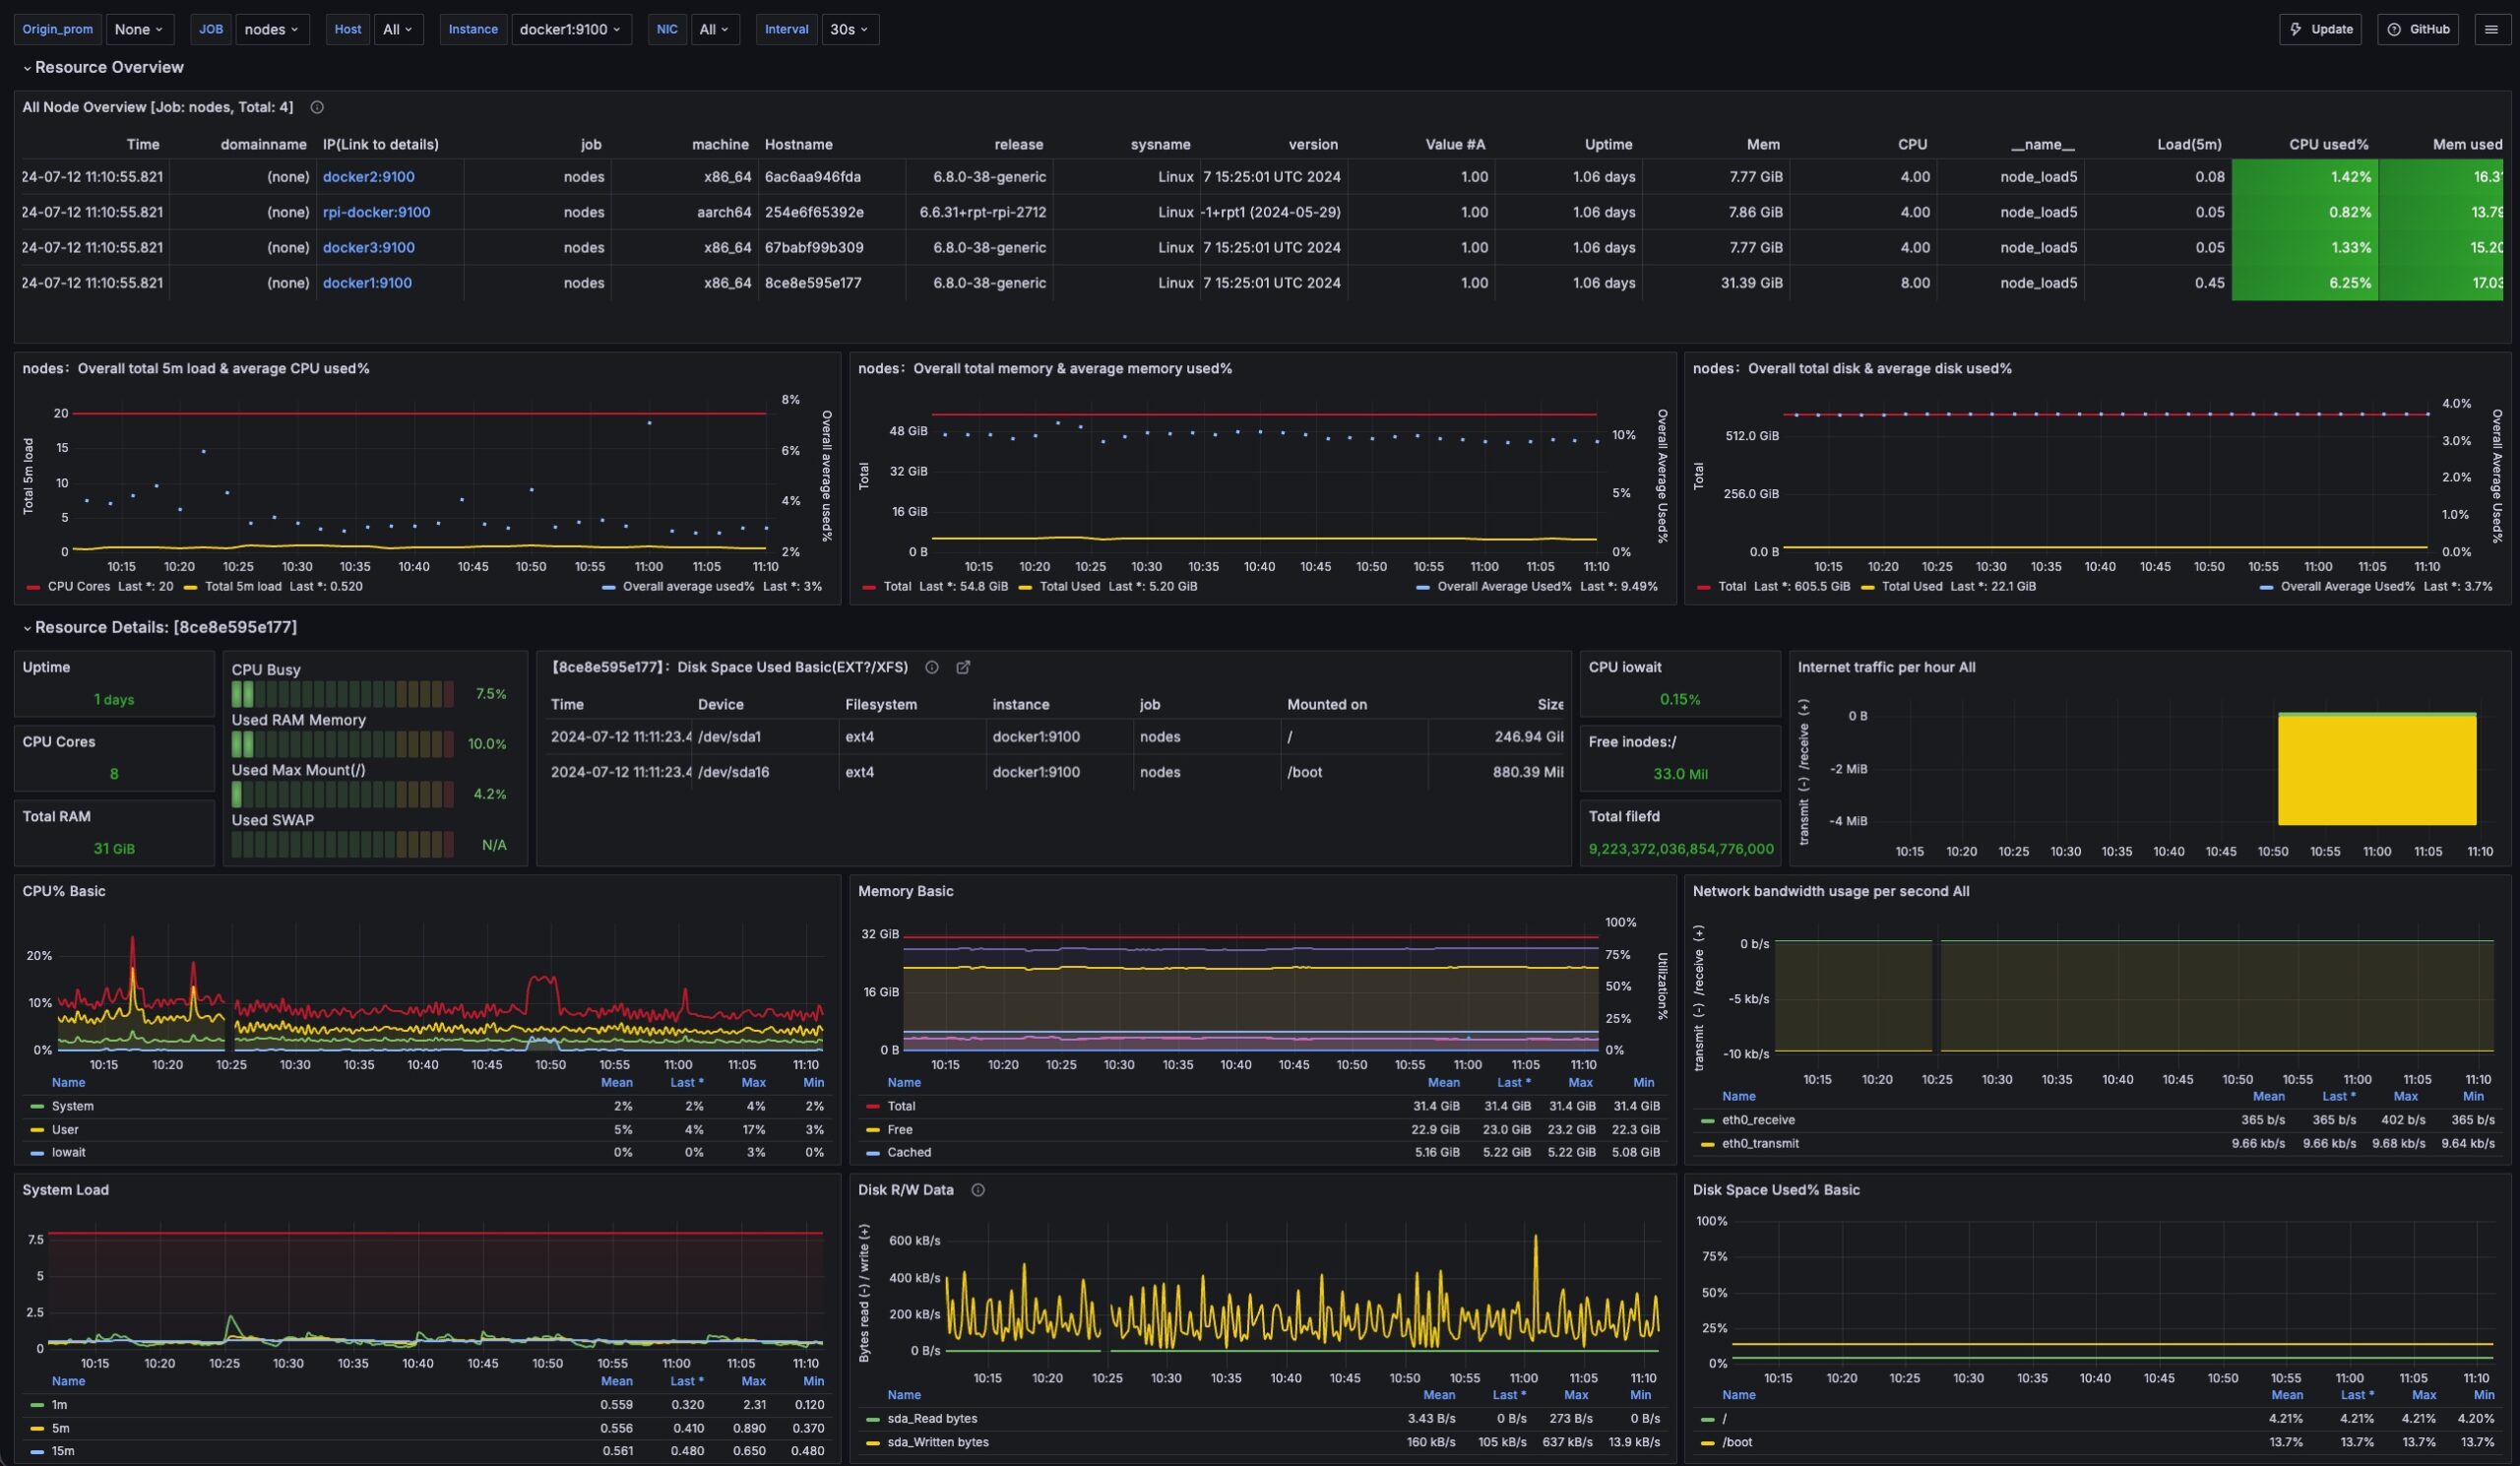
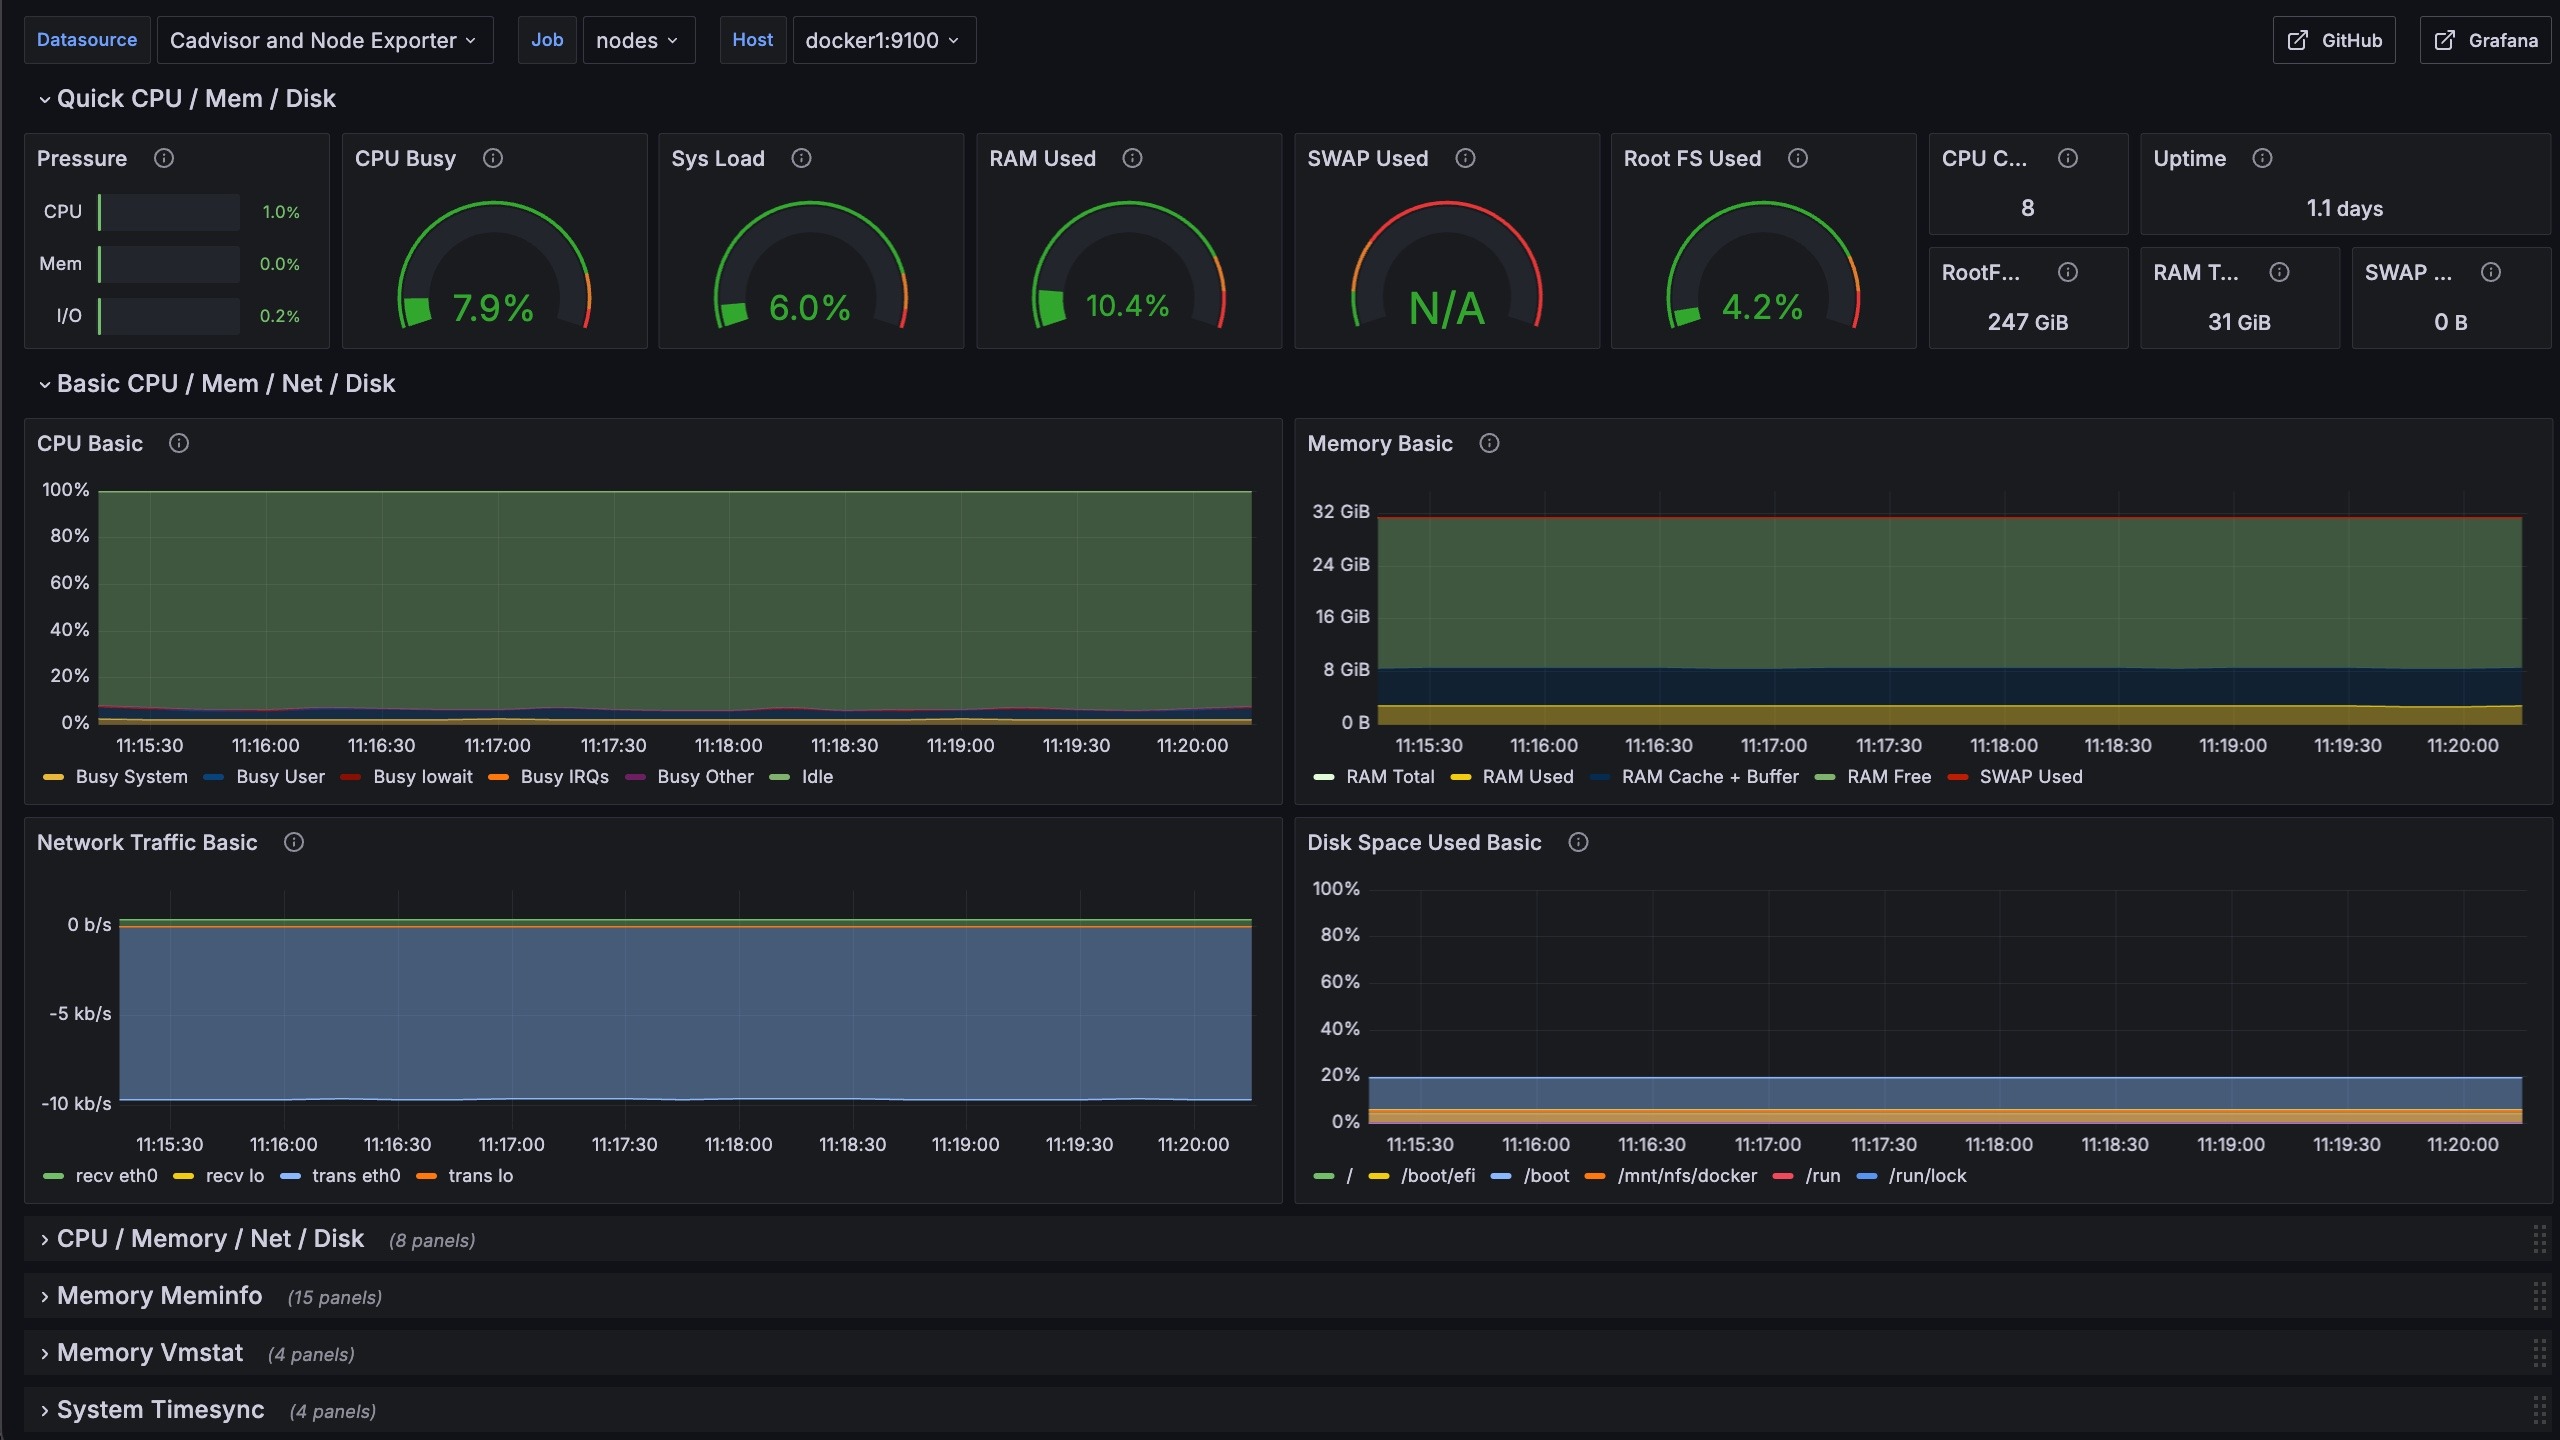
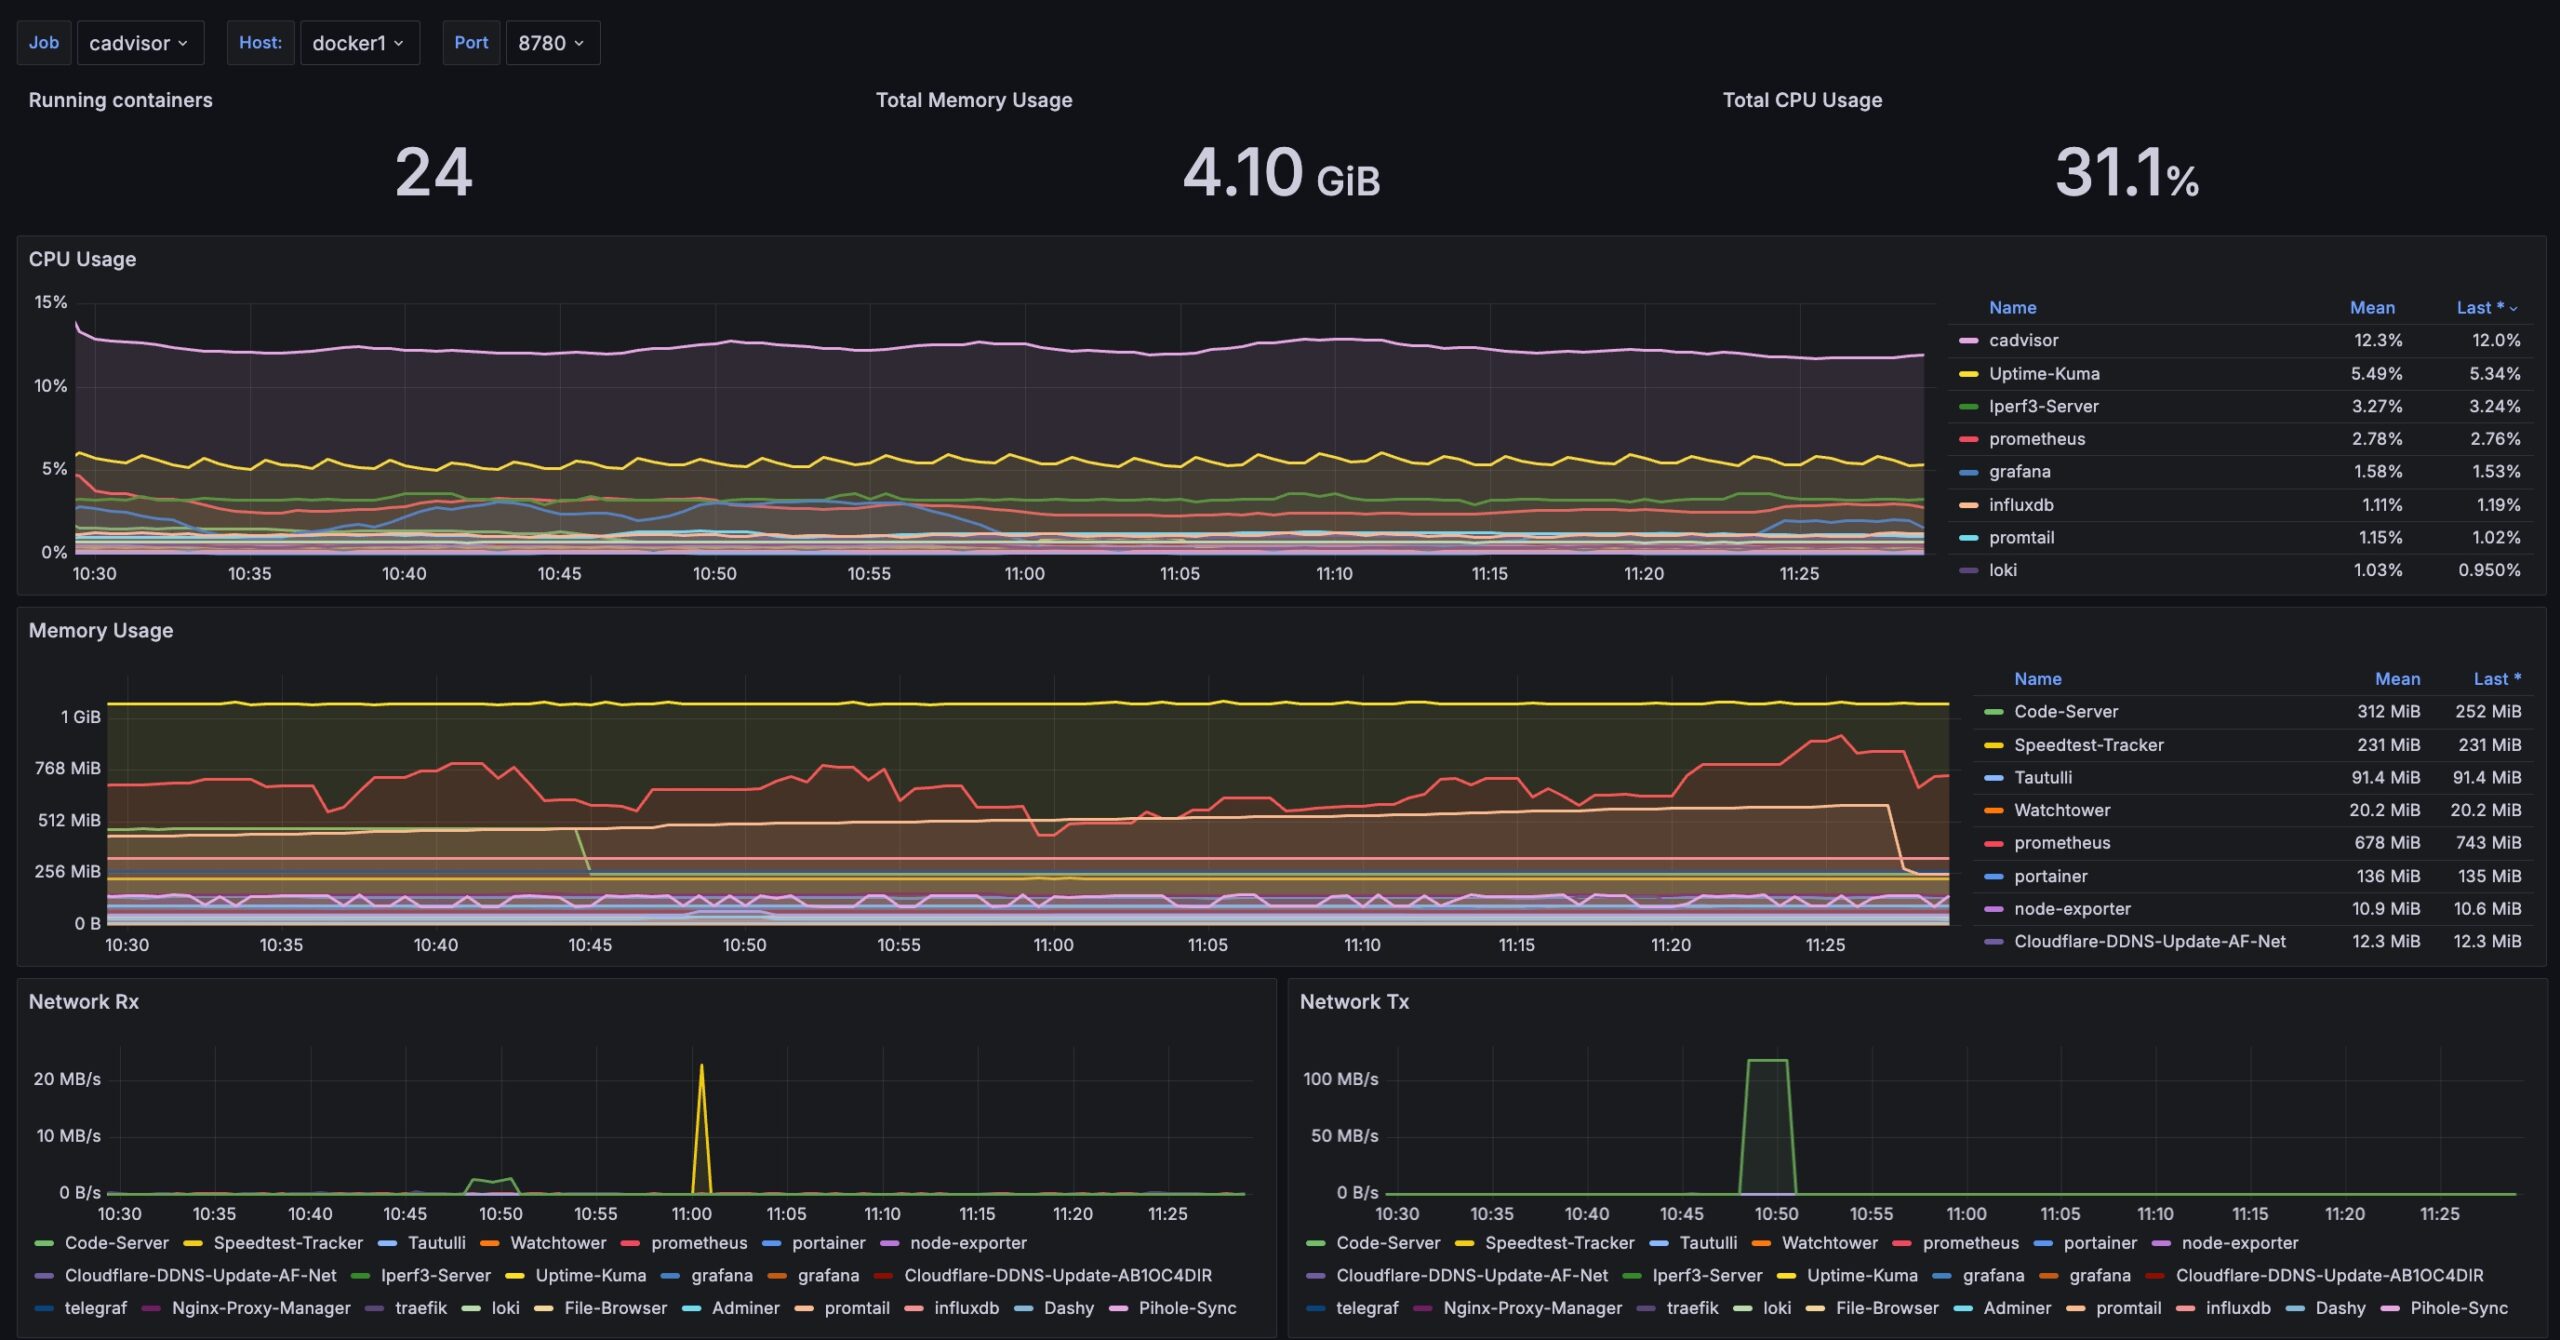
We run a combination of Node Exporter and cAdvisor on each Docker host VMs. These containers scrape data for our Docker hosts and feed it to the Prometheus instance in our Docker stack.
The following video explains how all of this is set up –
Dashboards
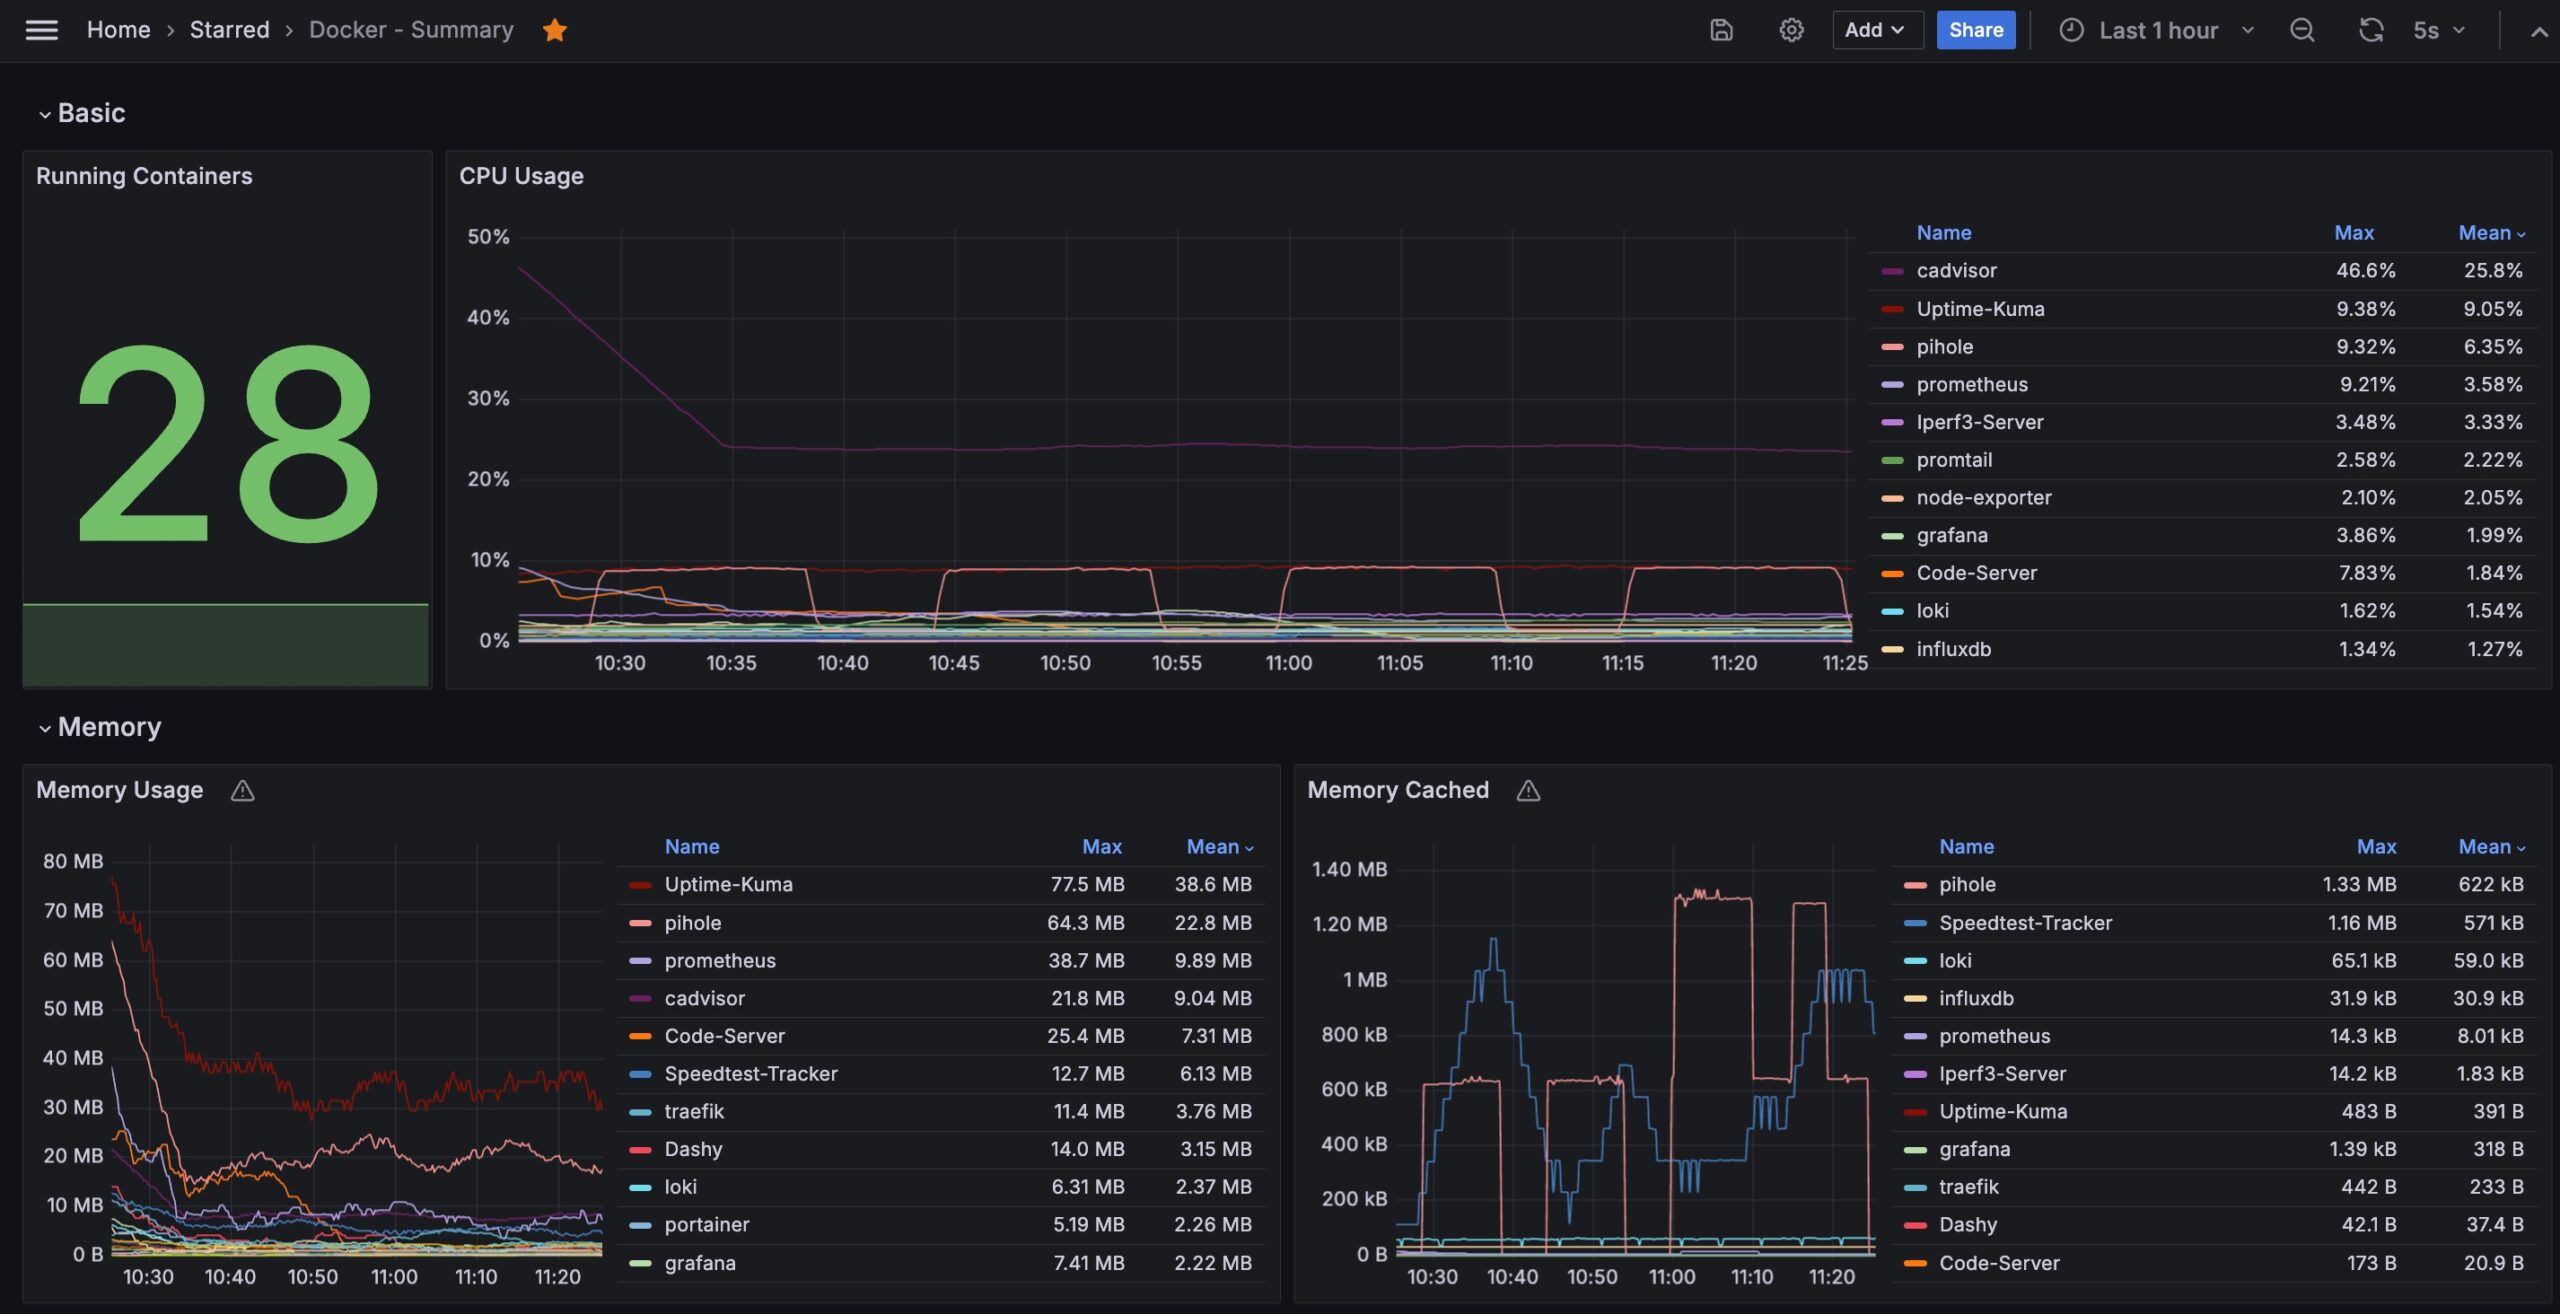
We are using several dashboards to implement our Docker monitoring solution.
The following sections cover the setup and configuration of our monitoring stack.
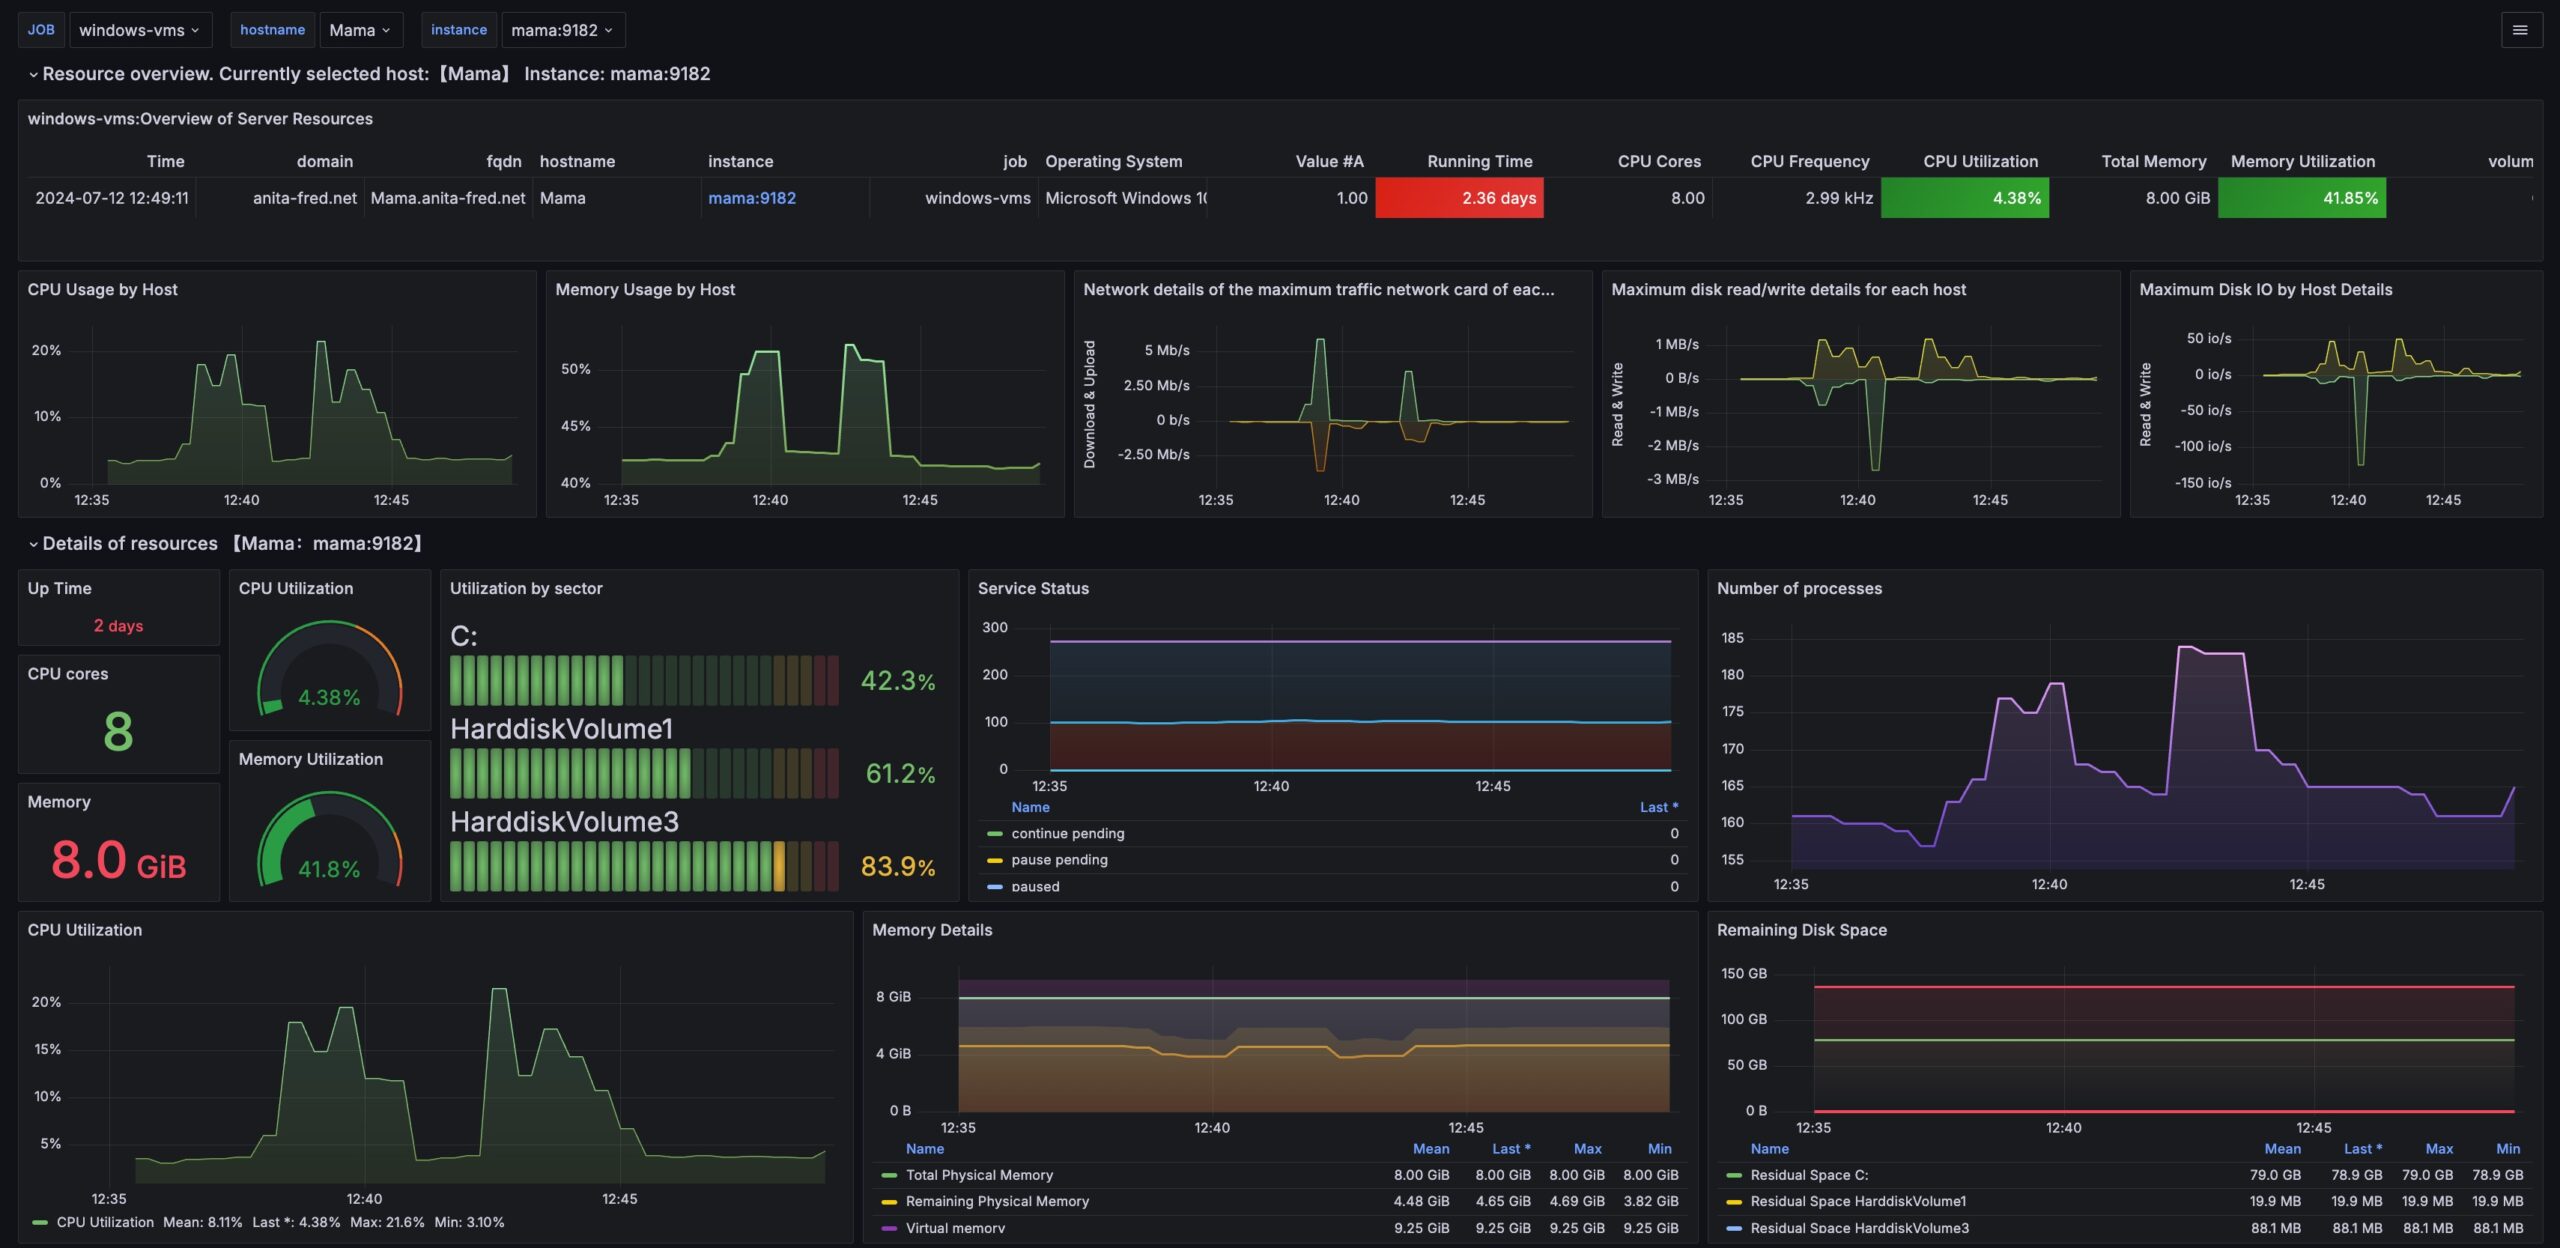
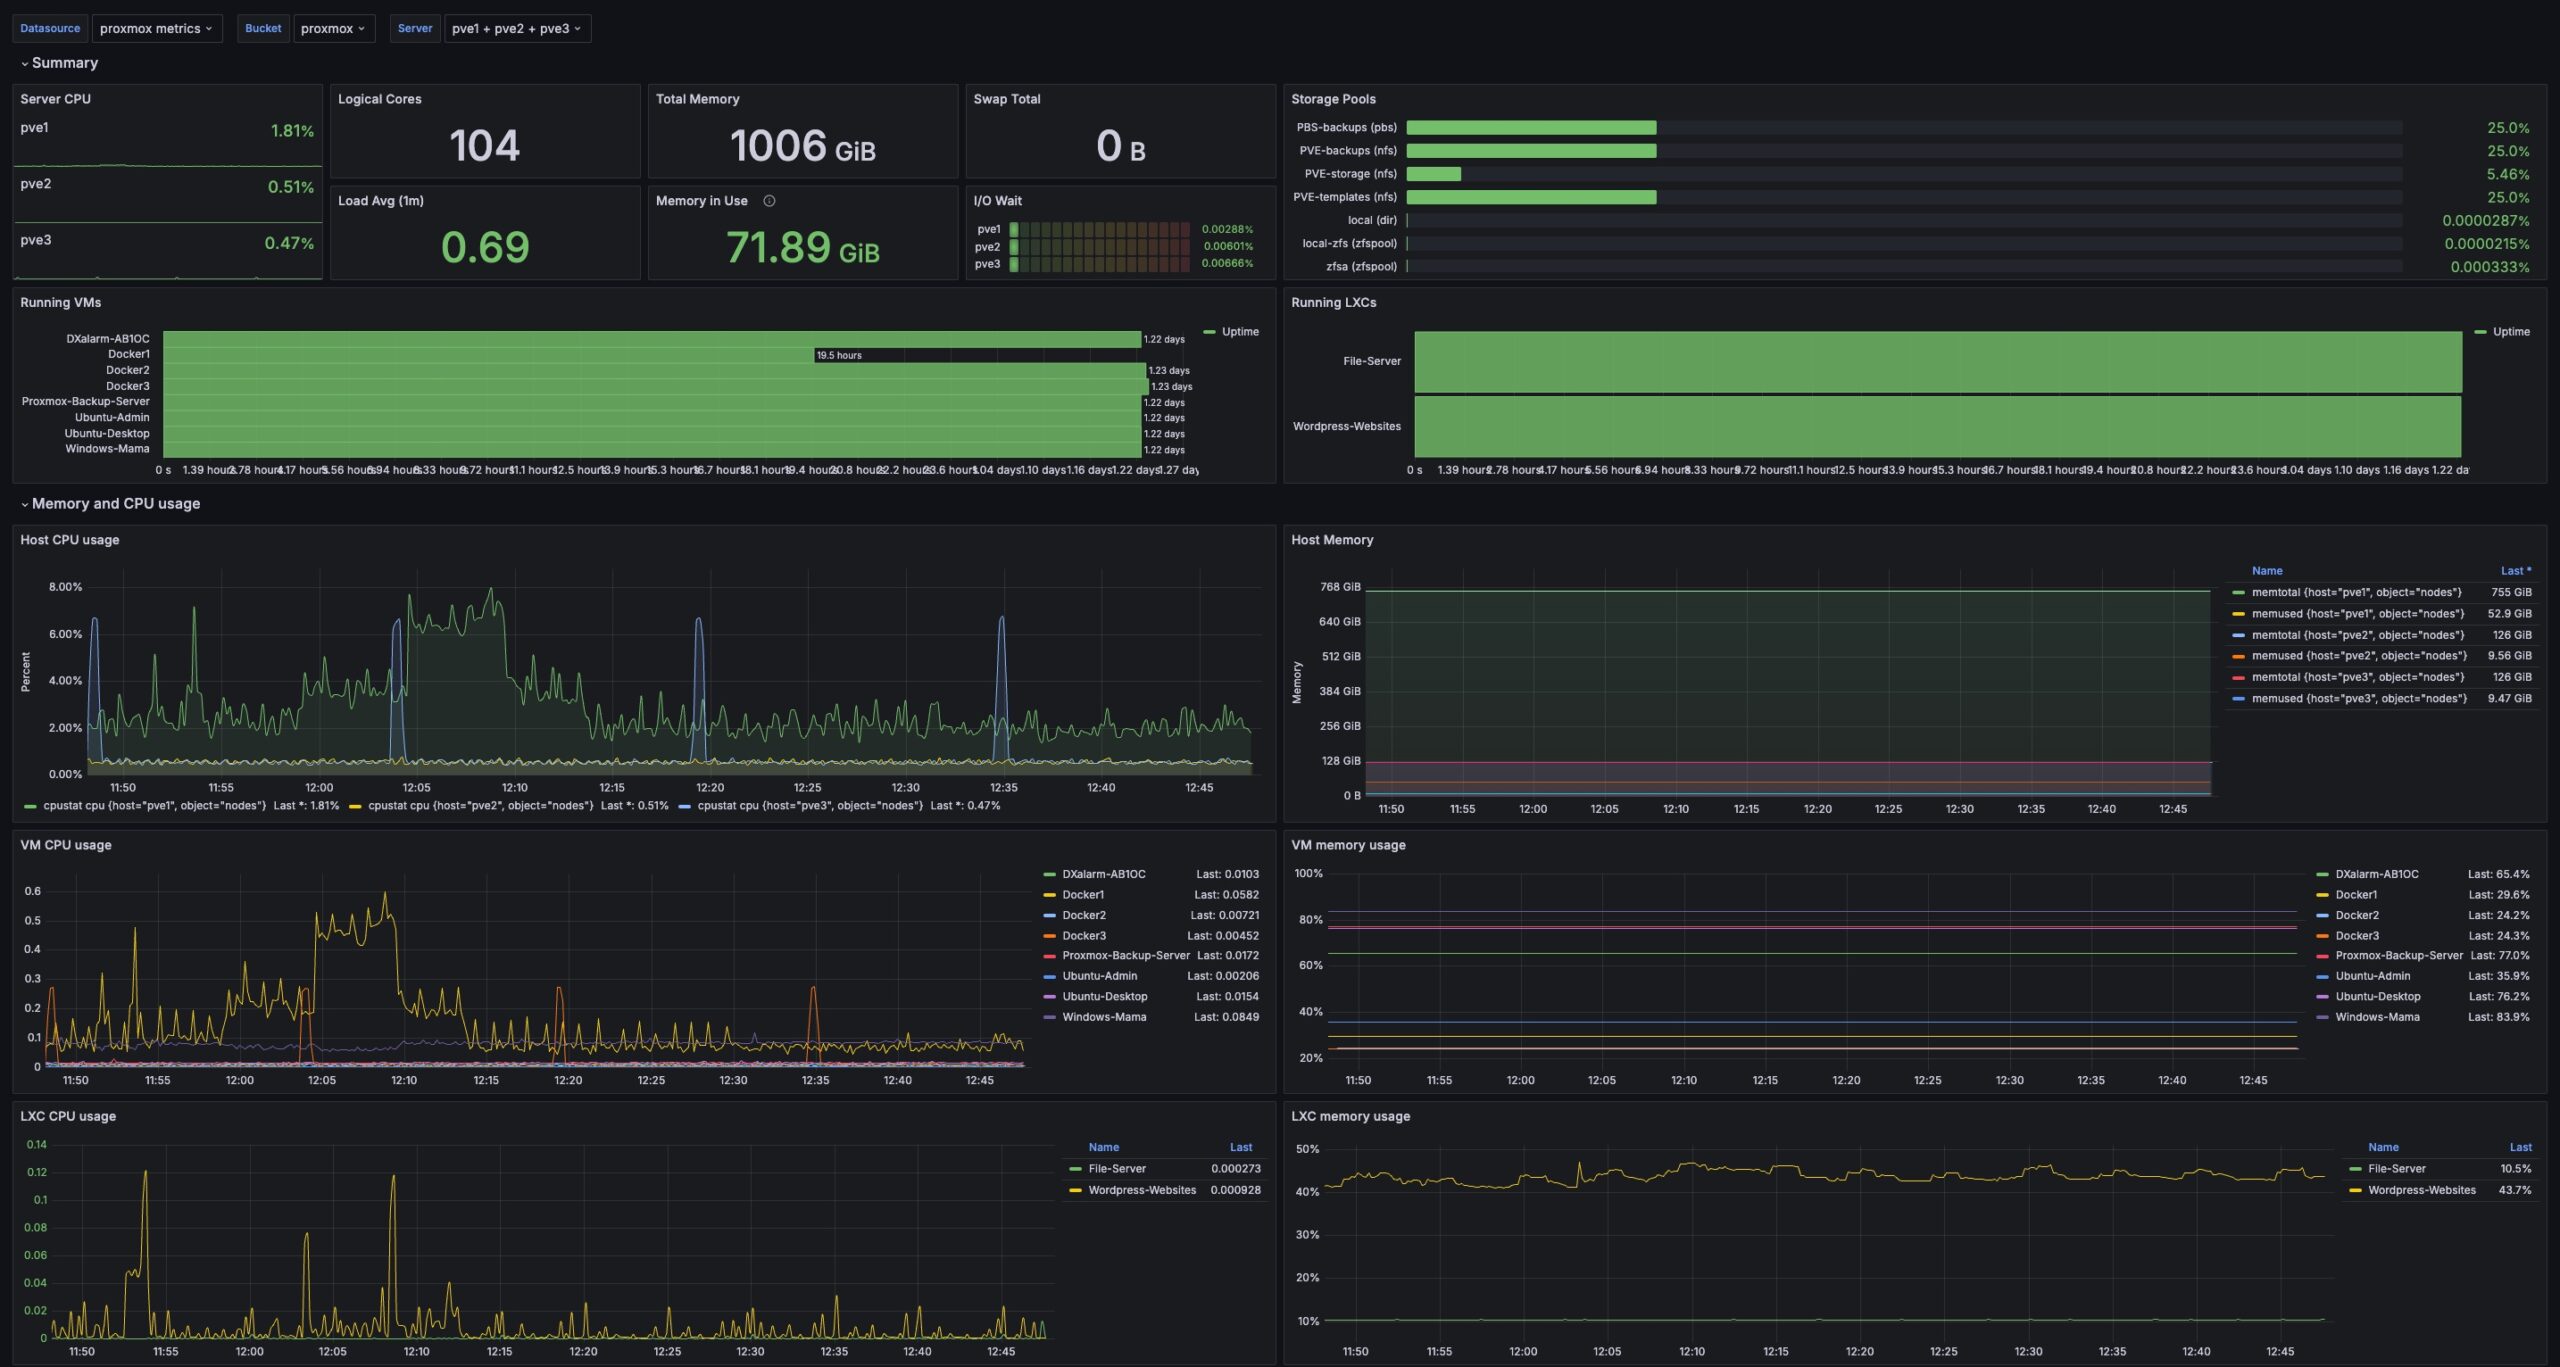
Proxmox Monitoring Setup
The following video explains how to set up a Grafana dashboard for Proxmox. This installation uses the monitoring function built into Proxmox to feed data to Influx DB.
And here is a video that explains setting up self-signed certificates –
Grafana Lofi and Promtail work together to scape and store log data. These tools can scrape docker data and accept syslog data as well. The following video explains how to configure Loki and Promtail.
The links for configuring the Loki Docker driver can be found here and here.
Set parameters in the Loki Docker driver via /etc/docker/daemon.json to avoid blocking the Docker.
Recreating containers with Portainer does not enable Lofi to access their logs. To make this work, we needed to use docker compose up -d –force-recreate
The contents of /etc/docker/daemon.json are as follows:
We have configured a combination of Loki and Promtail to accept Syslog events. Promtail does not support Syslog events using the UDP protocol. To solve this problem, we set up rsyslog running under the Ubuntu system, which hosts the Promtail Docker container, to consolidate and forward all Syslog events as a front end to Promtail. Information on configuring rsyslog as a front end to Promtail can be found here.
Monitoring Dashboards
The following video provides some information on configuring dashboards and other monitoring capabilities.
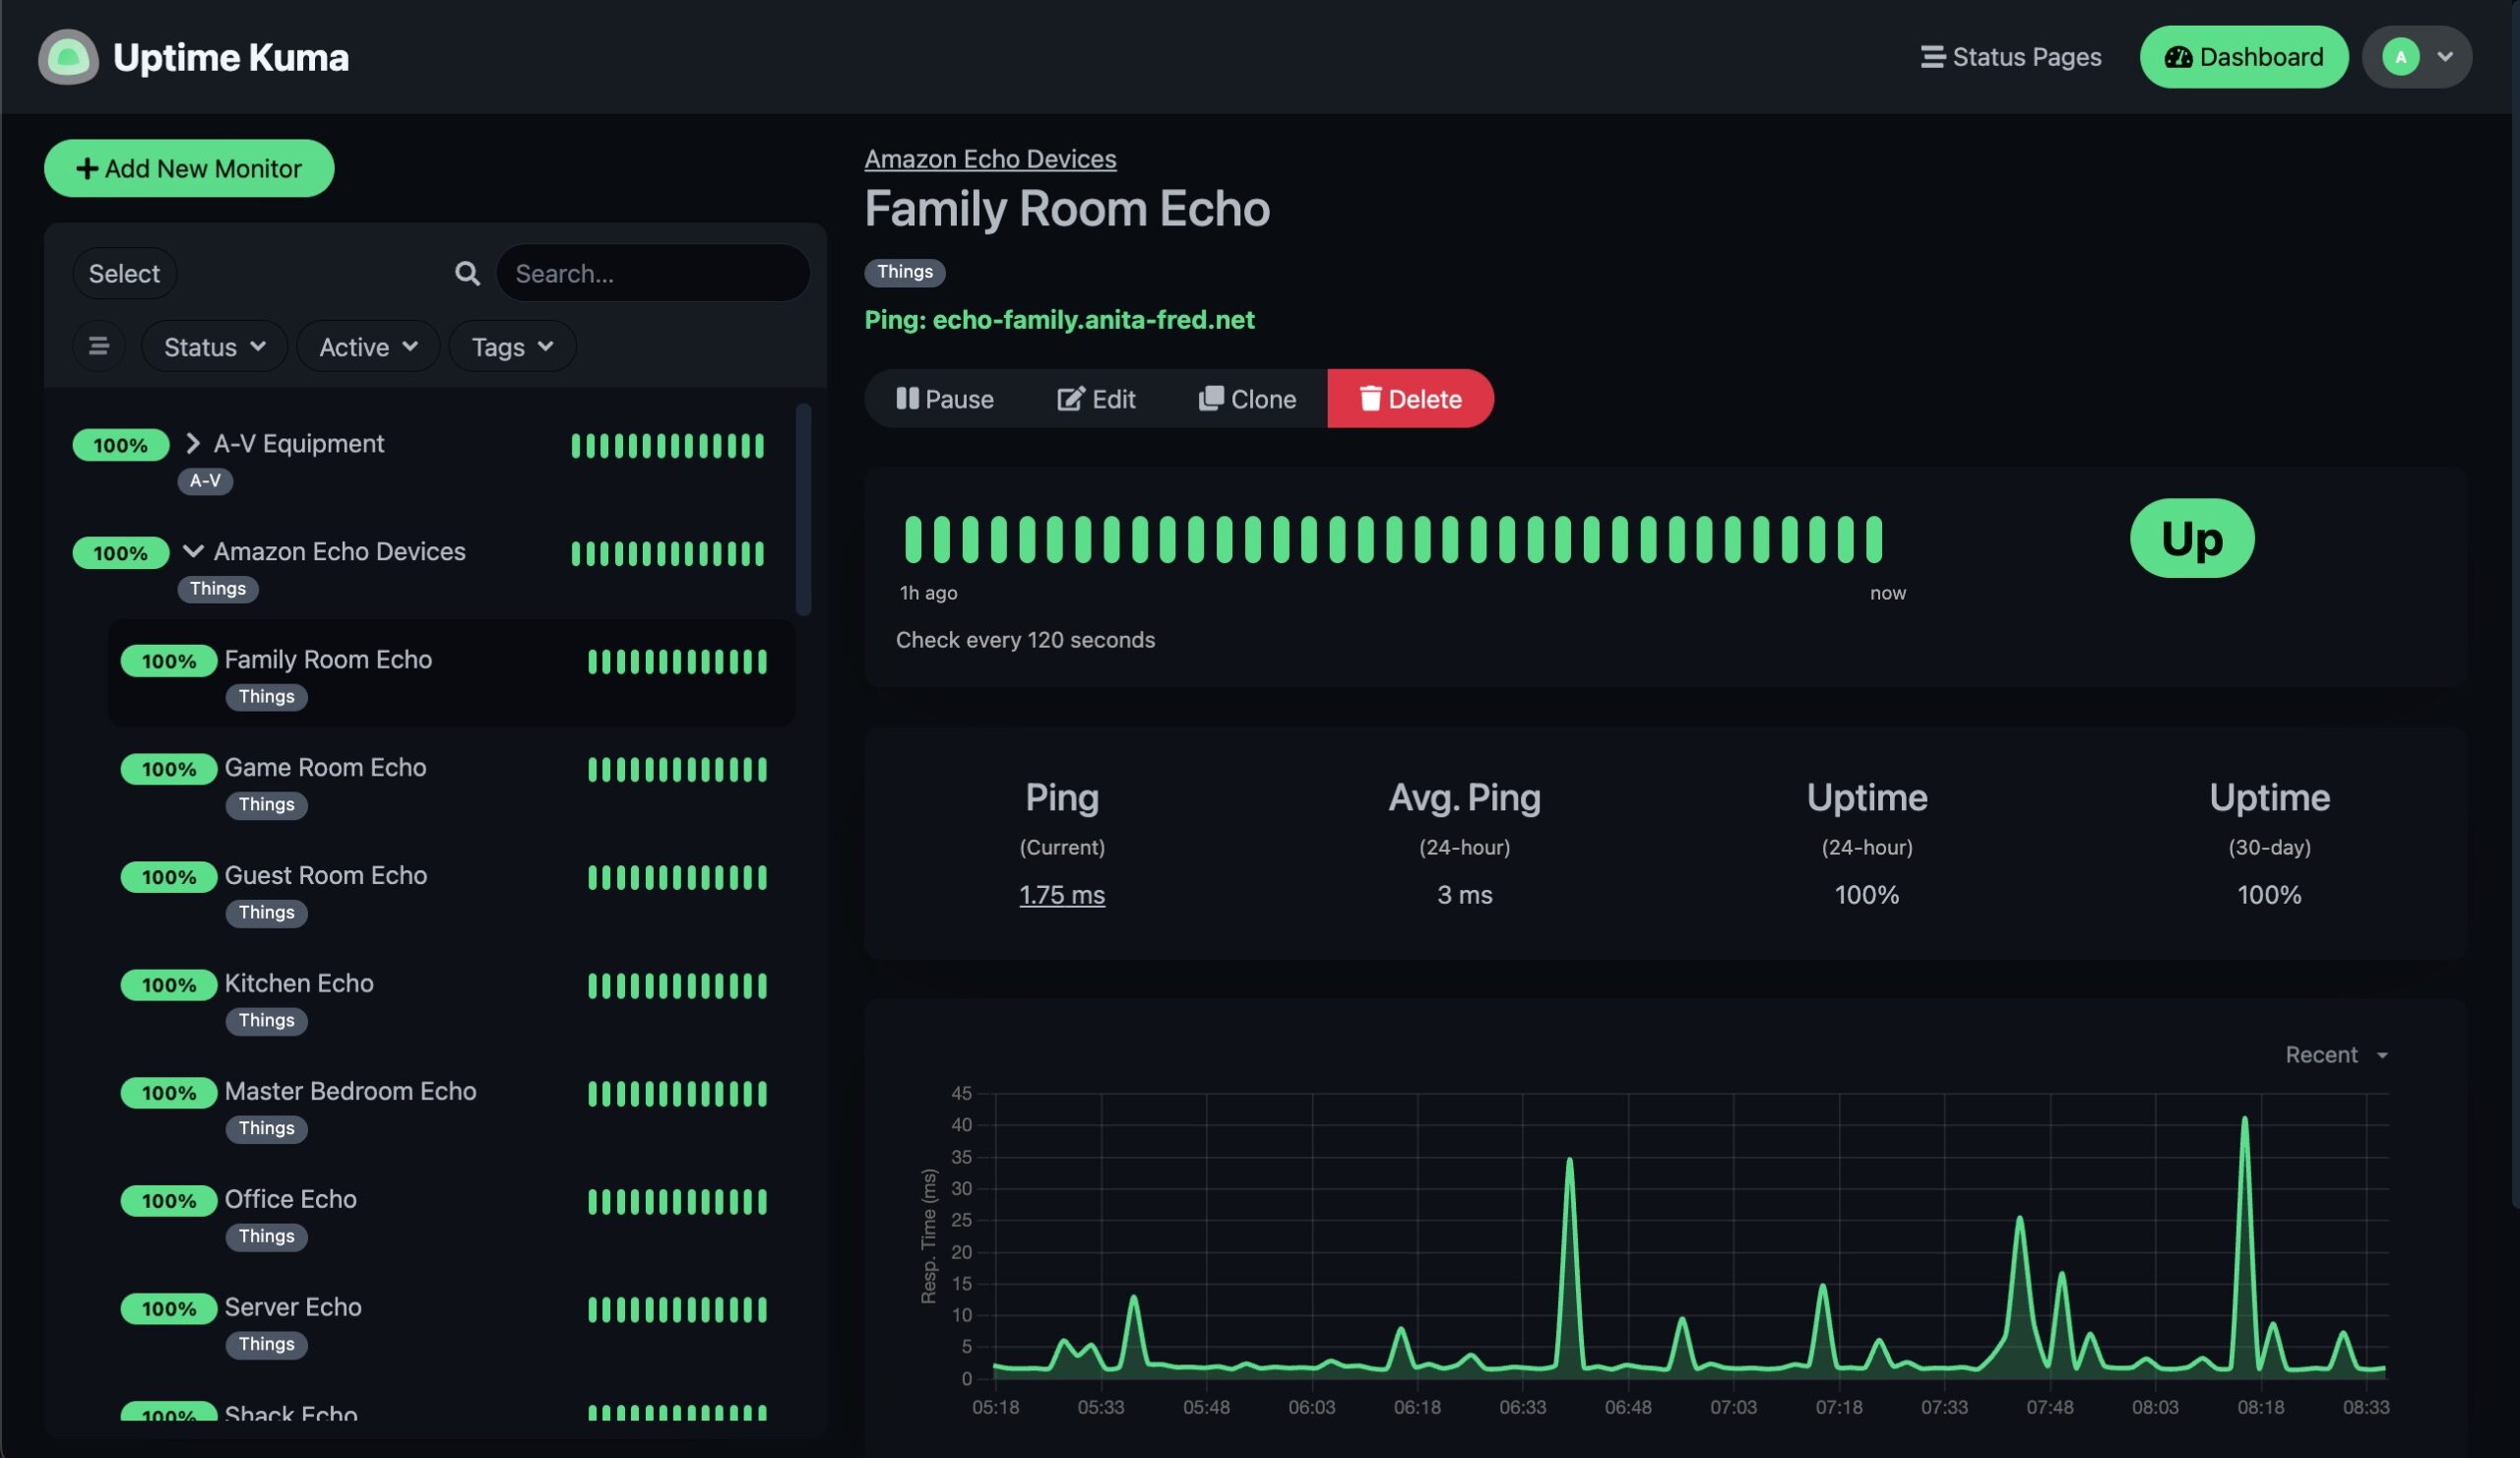
As our Home Lab and the associated network become more complex, monitoring the operational status of our services and equipment becomes essential. We use a tool called Uptime Kuma to monitor the operational status of our home lab. This tool can monitor various types of equipment and services, providing multiple mechanisms to notify us when a service is unavailable.
Uptime Kuma Docker Install
We deployed this tool as a Docker container in our Docker cluster. It is easy to install and configure. We used the following video to help with the installation –
Uptime Kuma can be used to monitor the health of Docker containers running on Local and Remote Docker Hosts.
The Local Docker Host can be monitored by binding /var/run/docker.sock to the Uptime Kuma container.
Some additional configuration is required on Remote Docker Hosts to expose Docker information.
The process for setting up both of the cases is covered here.
Performance and Backups
The tool’s database is sensitive to the volume store used to contain its database. For this reason, we bound Uptime Kuma’s present volume to storage inside the Docker Host VM instead of using our high-availability network store.
We also used the root crontab to back up the local VM configuration data to the Docker volume on our high-availability store as follows:
# Backup local VM configuration for uptime kuma
# to HA docker volume
*/15 * * * * /usr/bin/rsync -r --delete \
    /home/ubuntu/uptime-kuma/ \
    /home/ubuntu/docker/uptime-kuma/data