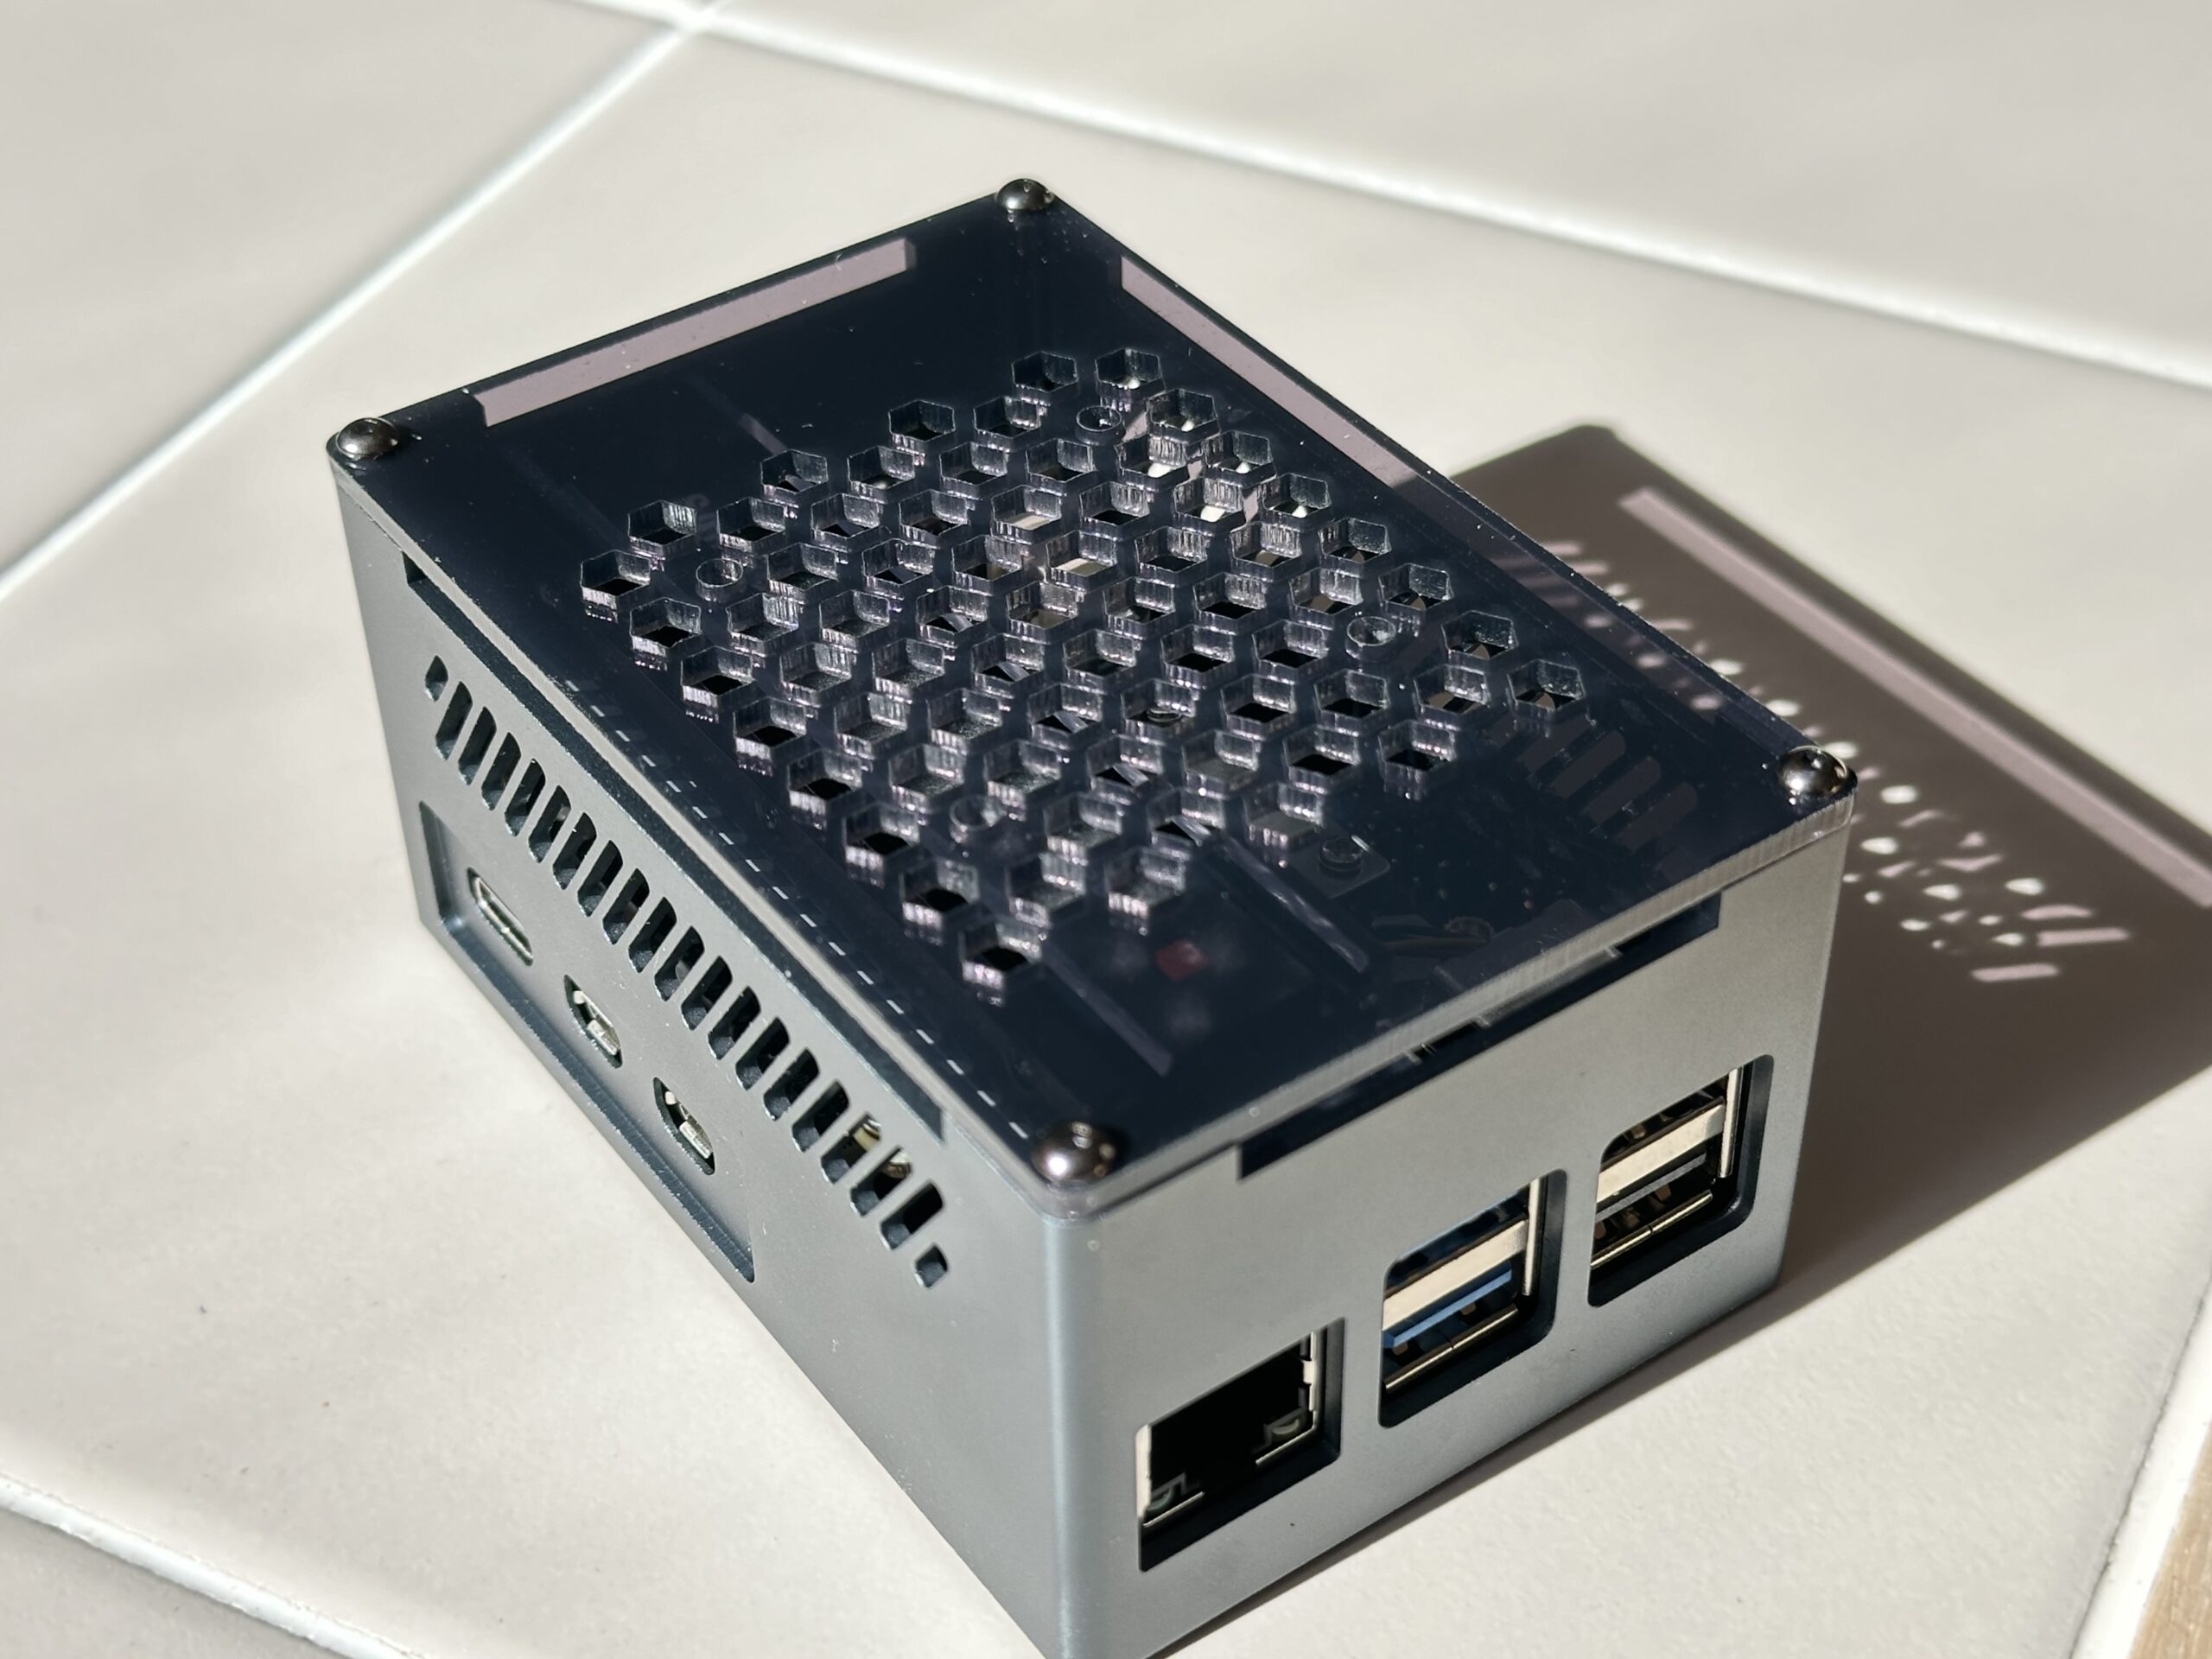
While having enterprise-grade equipment in our Home Lab is nice, I aimed to build something simple. It had to be inexpensive for beginners. So, the solution is a simple Raspberry Pi Home Server.
Project Objectives
Many applications and services can be hosted on a home server. For this project, we choose a basic set of capabilities for our Raspberry Pi Home server project –
- Sharing files on a home network via Network Attached Storage (NAS)
- Photos, Music, Videos, Documents, …
- A DNS Server to create easy-to-remember names to access IP devices and services
- 192.168.1.xxx vs. your-service.your-domain.net
- Creating a personal domain via Cloudflare and obtaining a signed SSL Certificate for your web services
- Setting up a Reverse Proxy to tie it all together in a secure fashion
- Serving media for viewing across TVs, PCs, and Smart Devices (phones, tablets)
- Keep your devices and apps up and working via monitoring.
Also, this project can offer an opportunity to learn about and use modern IT technology, and one can build upon this project to add applications to –
- Create a website and share it with the world
- Build a ”Smart Home”
- Add a Home Lab dashboard
- …
We’ll be making use of Docker for much of this project. Sample Docker Compose files are included for many of the applications that follow. Note that files will need some adjustments. In particular, replace <example – password> items with your custom values. Use strong passwords. Keep your passwords and API keys secure.
Raspberry Pi Home Server Hardware

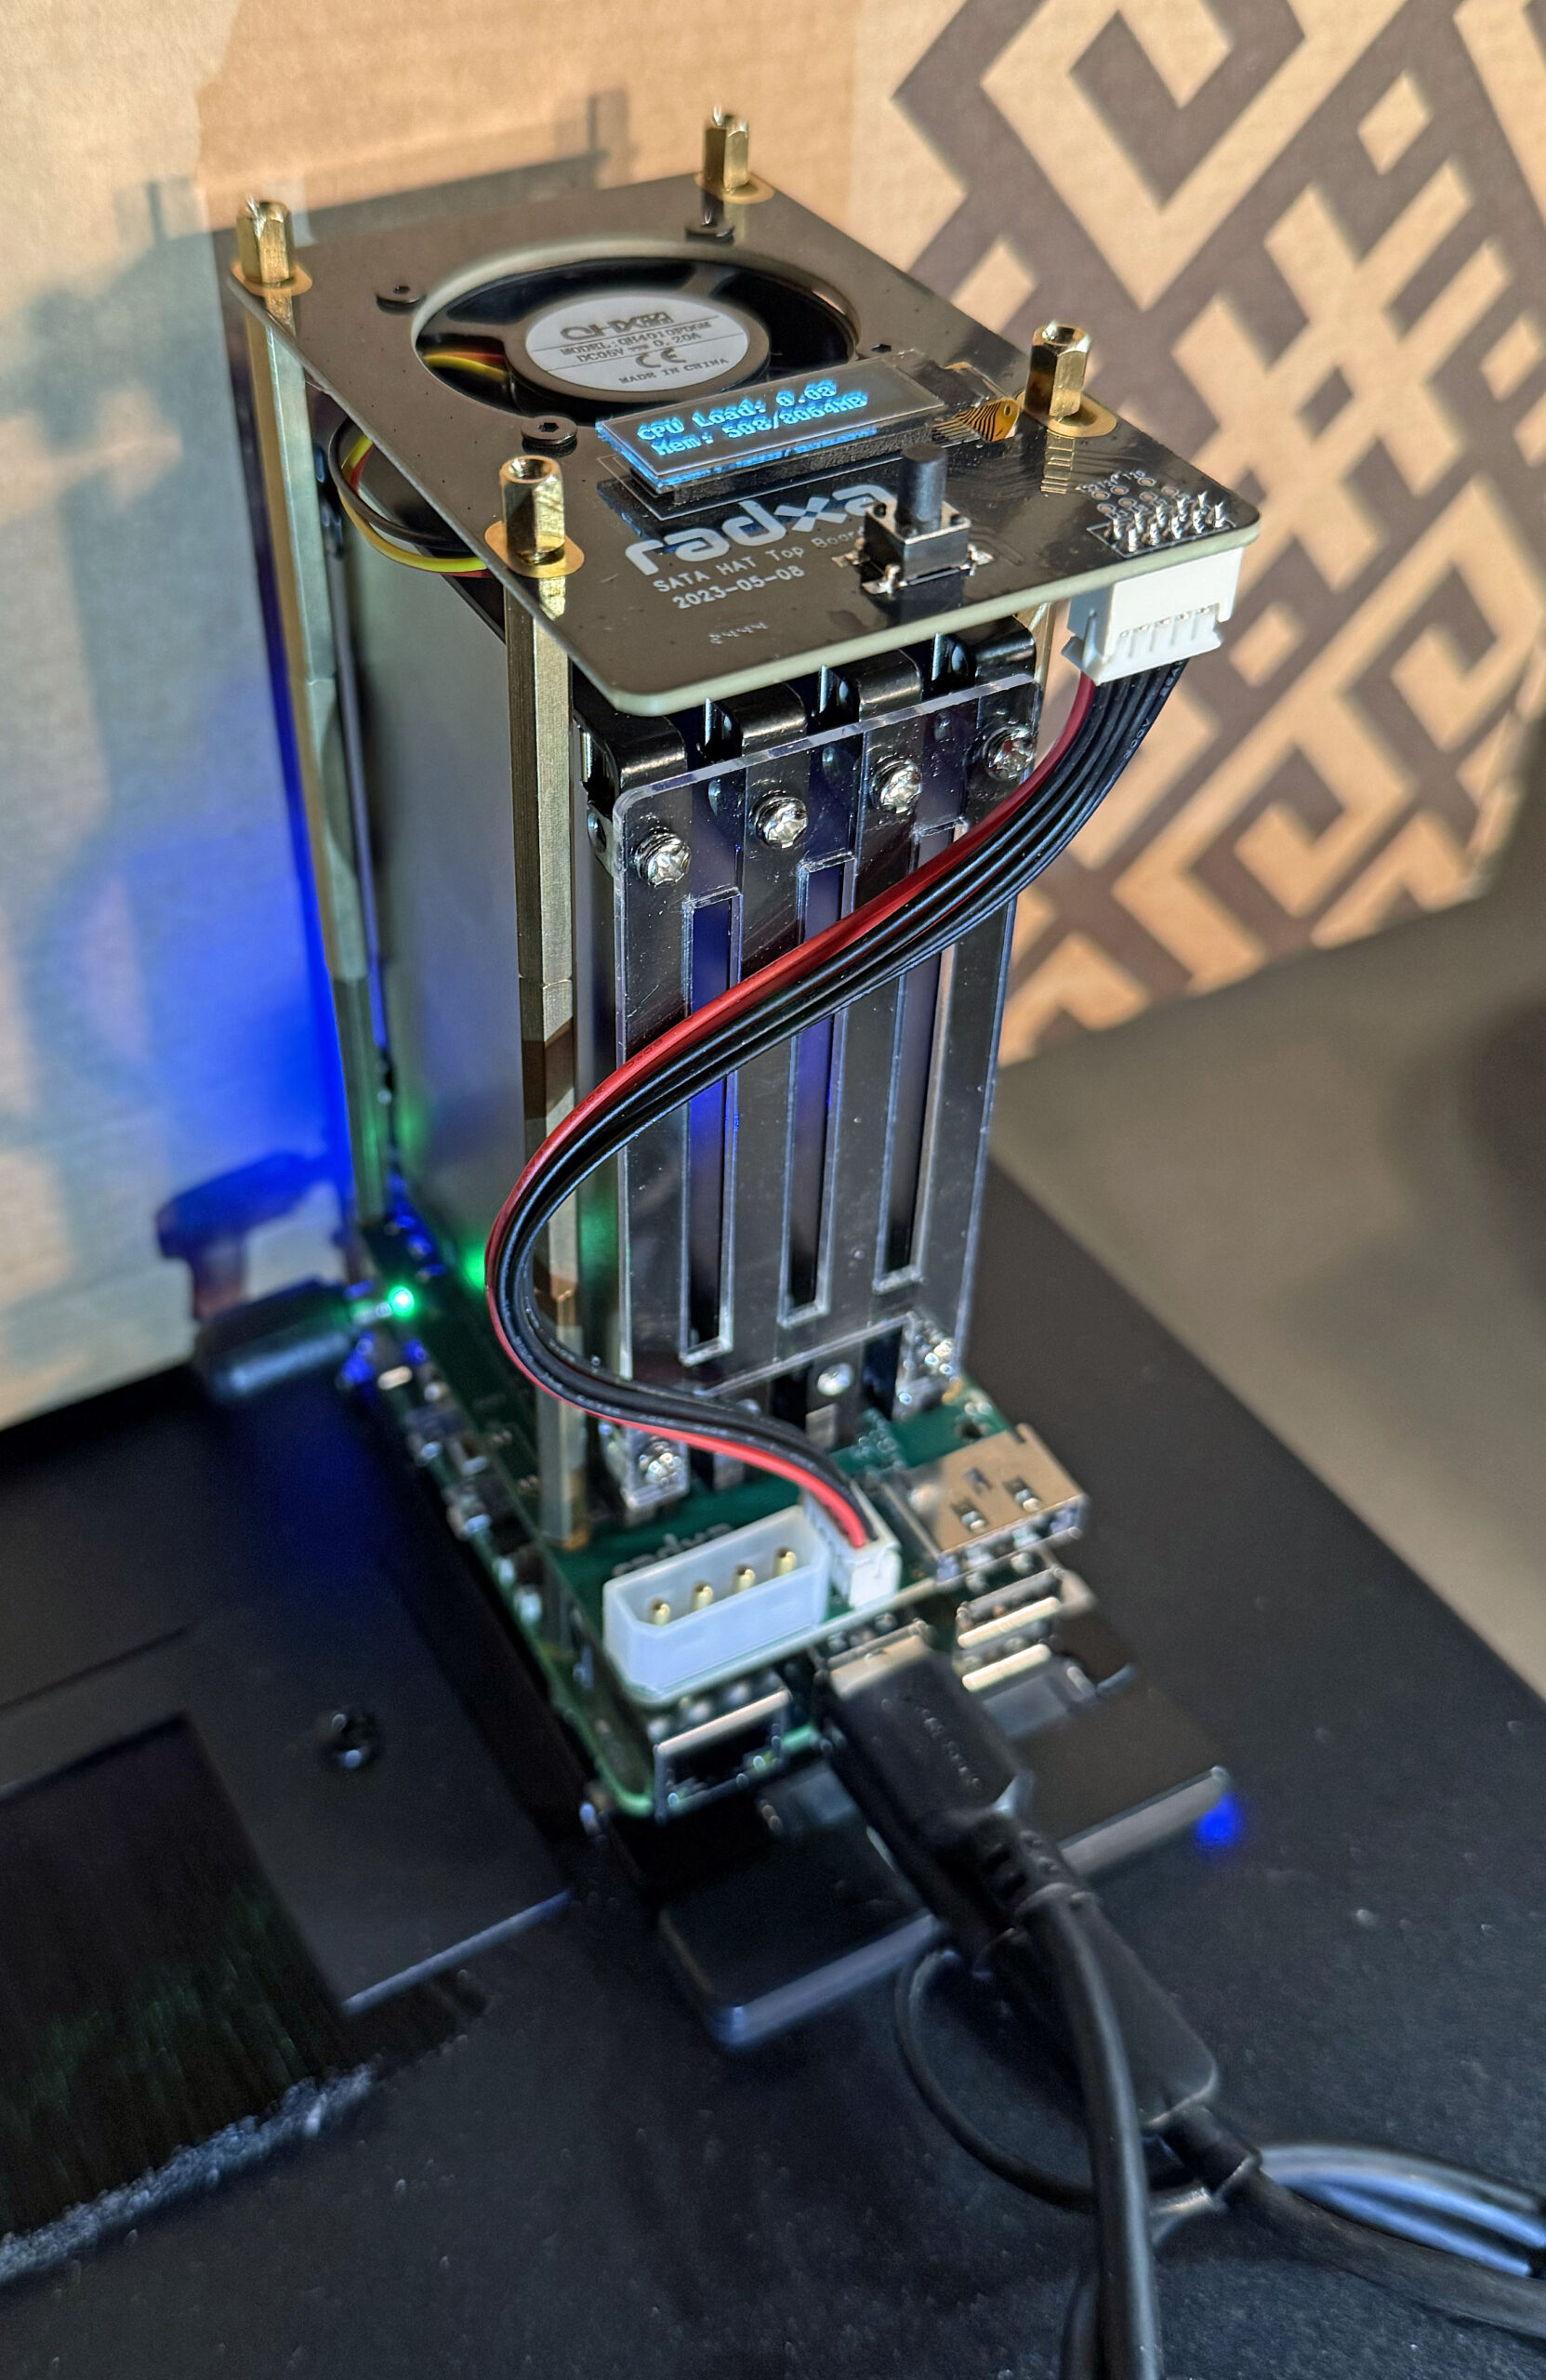
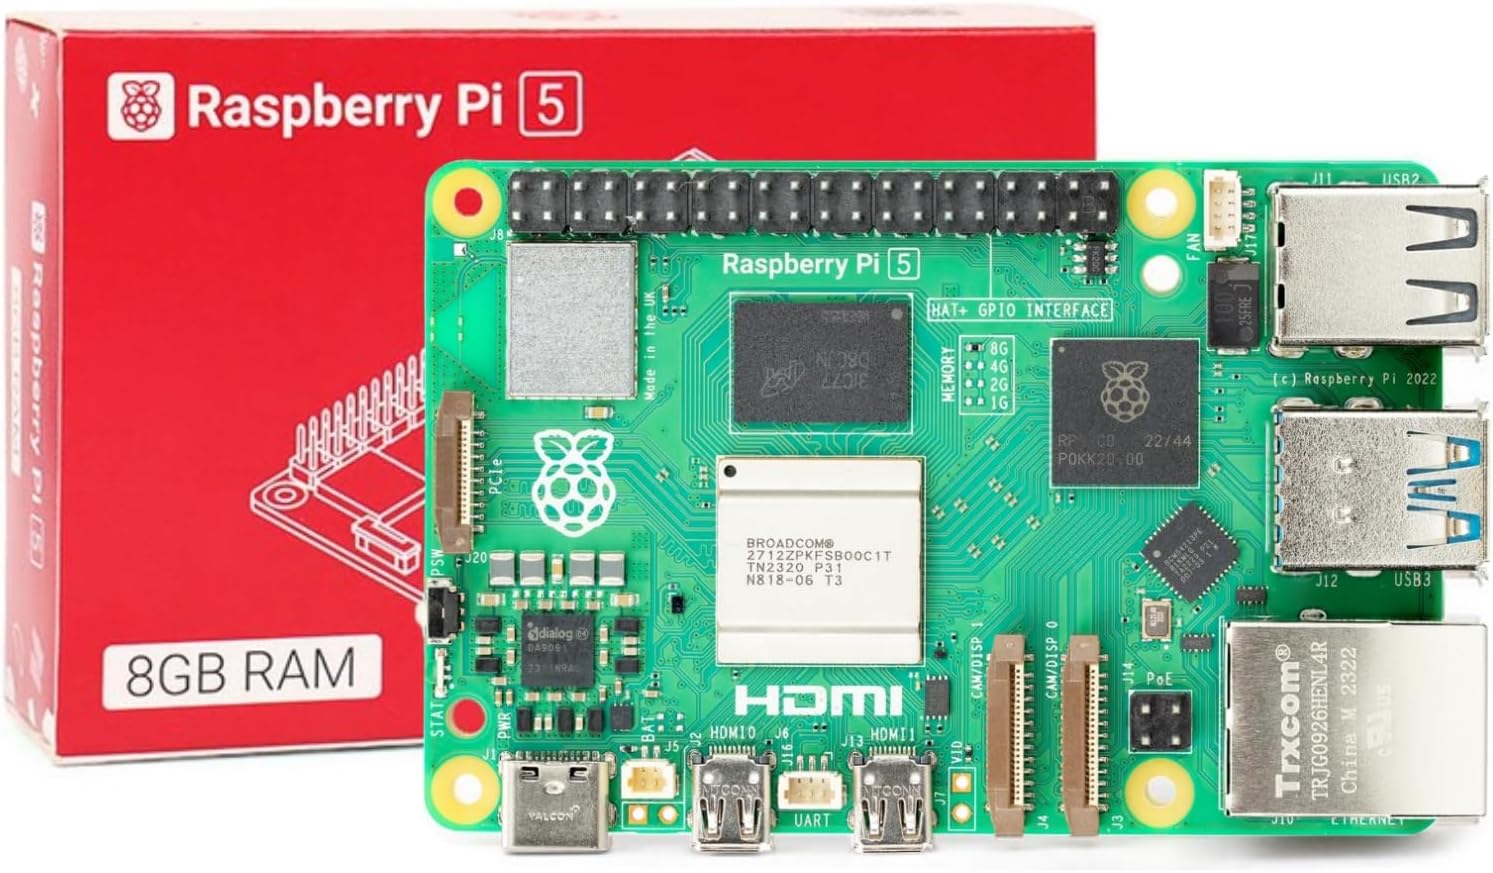
We recommend a Raspberry Pi 4B or Pi 5 system with 8 GB of RAM for your home server. For storage, we recommend an SSD device for reliability and capacity reasons. Below are links to systems that we’ve built.
- PiNAS – RPi 5 system with a 2 TB NVMe drive
- PiNAS 2 – RPi 5 system with 4 x 2.5″ SSDs
- PiLab – RPi 4B System with a 1 TB 2.5″ SSD
- PiTech (coming soon) – RPi 5 System with a 2 TB 2.5″ SSD
If you buy new hardware to build your home server, I recommend a system like PiNAS. The PiLab and PiTech systems are good choices. These options are ideal if you already have a Raspberry Pi 4B or Raspberry Pi 5. Make sure you also have a suitable 2.5″ SSD drive available.
Project Prerequisites
The prerequisites below are needed for this project. We suggest that you finish these items in place before you start the rest of the steps outlined in the next sections –
- Raspberry Pi Hardware with adequate storage
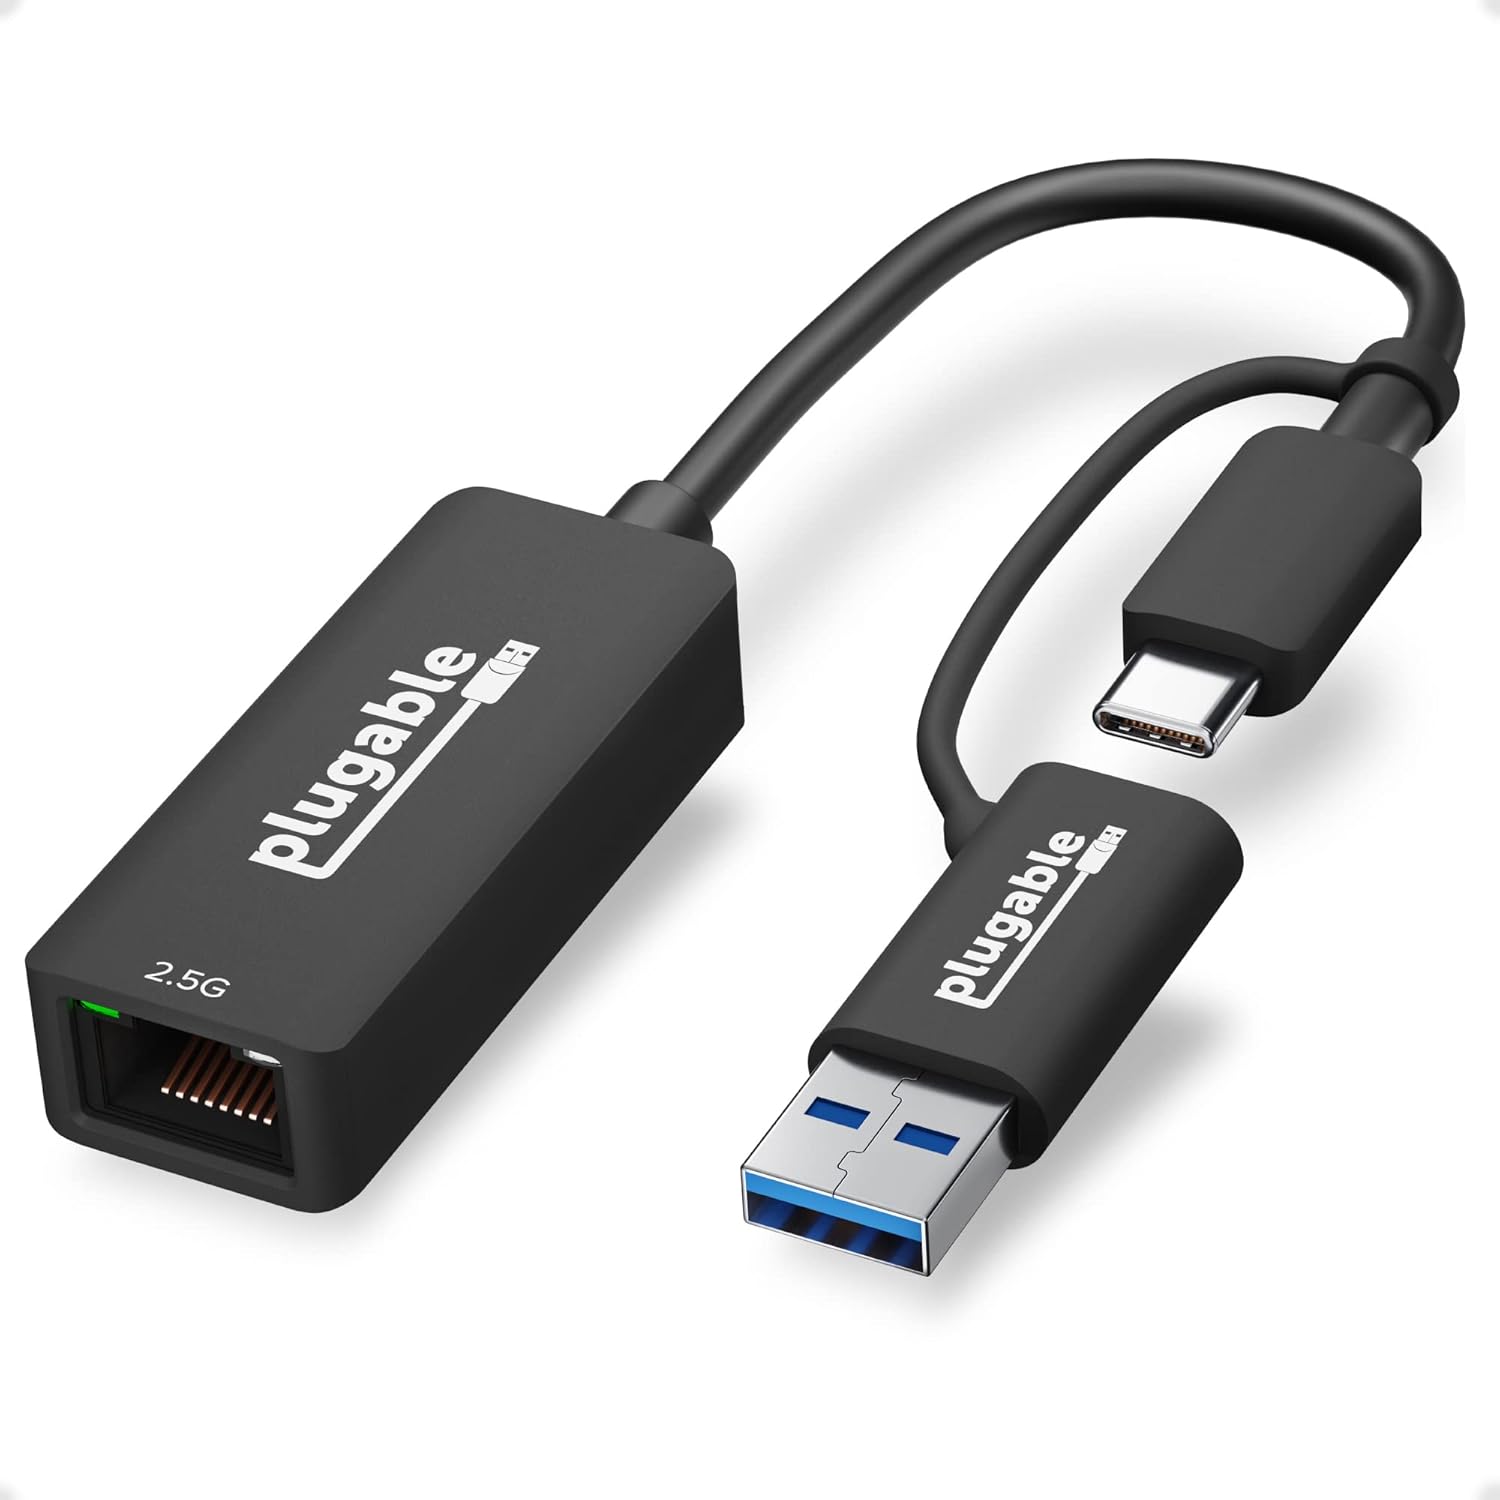
- Broadband Internet and a Router that you can set up to:
- Reserve IP addresses for your devices
- Open ports to the Internet
- A free account on Cloudflare
- Choose and register a domain on Cloudflare
- Suggest using a Password Manager like Dashlane to generate, encrypt, and store strong passwords
- Be sure to set up 2-factor Authentication for access to your Password Manager
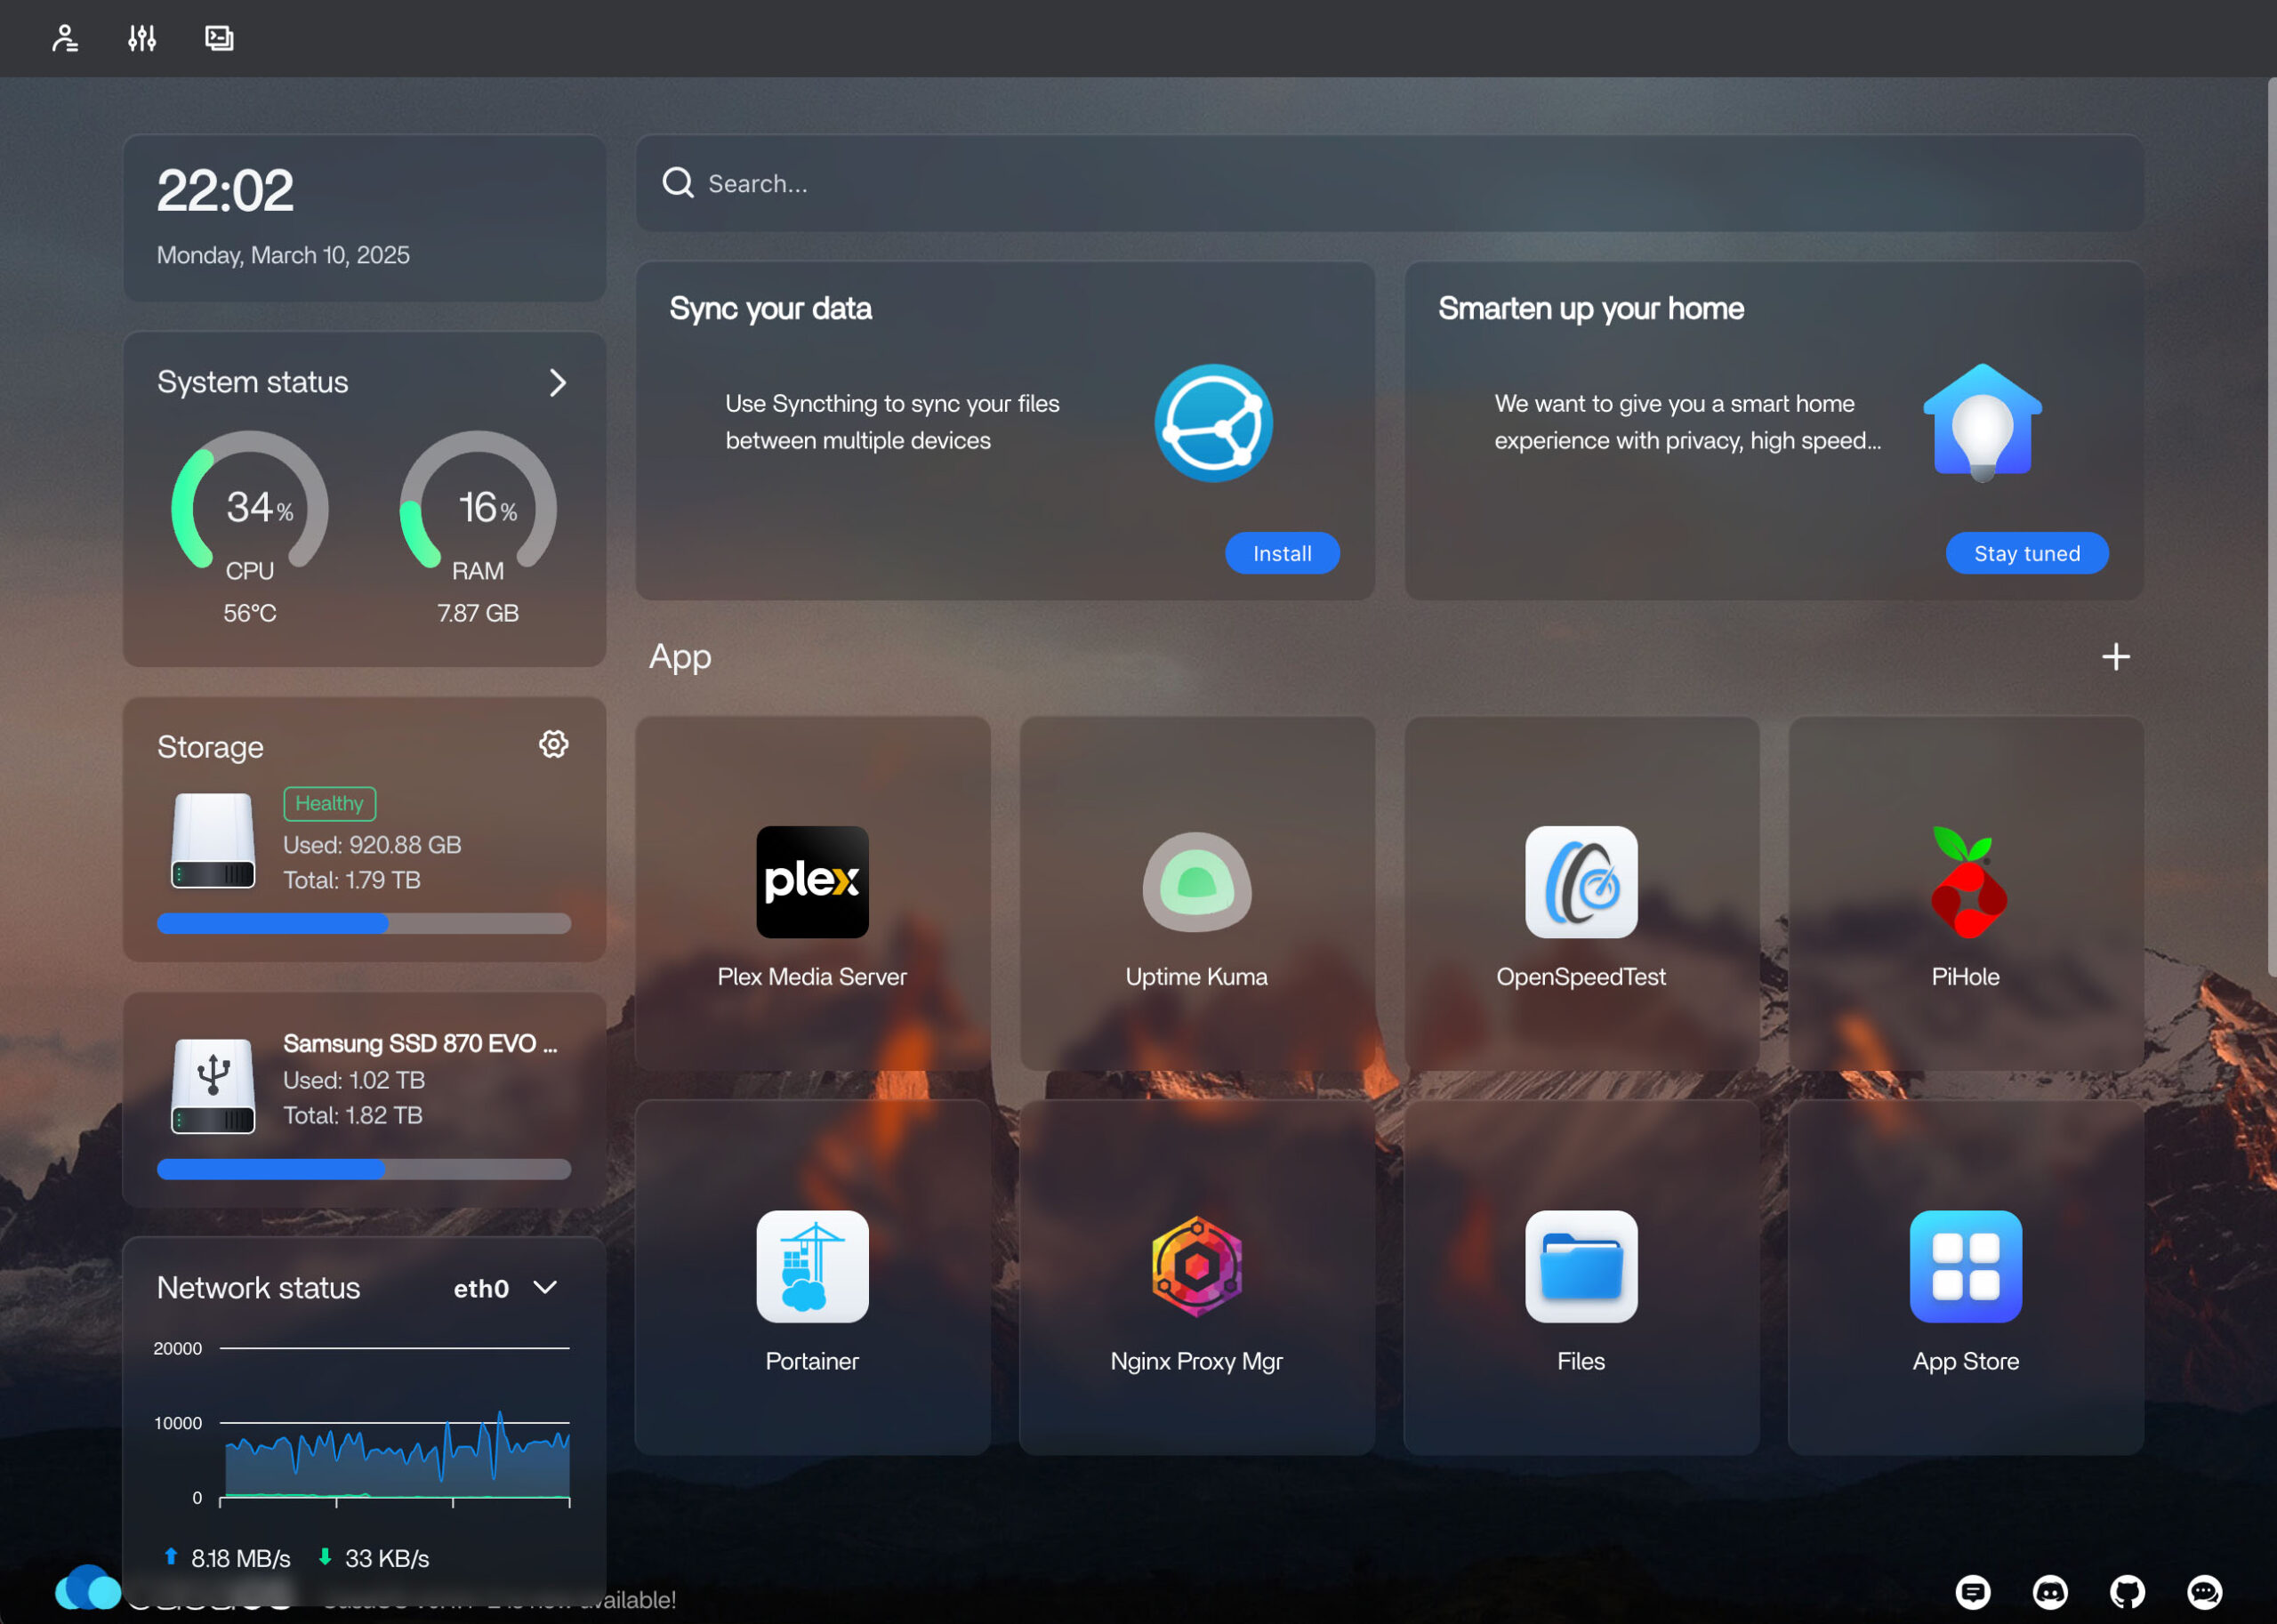
OS and CasaOS Installation
The video above covers the steps to install Raspberry Pi (RPi) OS and CasaOS on your Raspberry Pi. The steps are as follows –
- Assemble your hardware and connect the RPi
to your network – use a wired Ethernet - Install RPi OS 64-bit Lite via network install
- Update your RPi OS
- Set up the OS
- Generate a key pair and set up SSH
- Set up a reserved IP address for your RPi in your router
- The exact procedure depends on your router model
- Install CasaOS
- $ curl -fsSL https://get.casaos.io | sudo bash
- Set CasaOS login and password
Once CasaOS is up and running, we recommend doing the next steps –
- Set up a fixed IP assignment for your server in your router’s DHCP settings (note the IP – we’ll use it in the steps that follow)
- Set a strong Linux password via the CasaOS terminal
- Change CasaOS port from 80 to 9095
Setup Network Attached Storage (NAS)
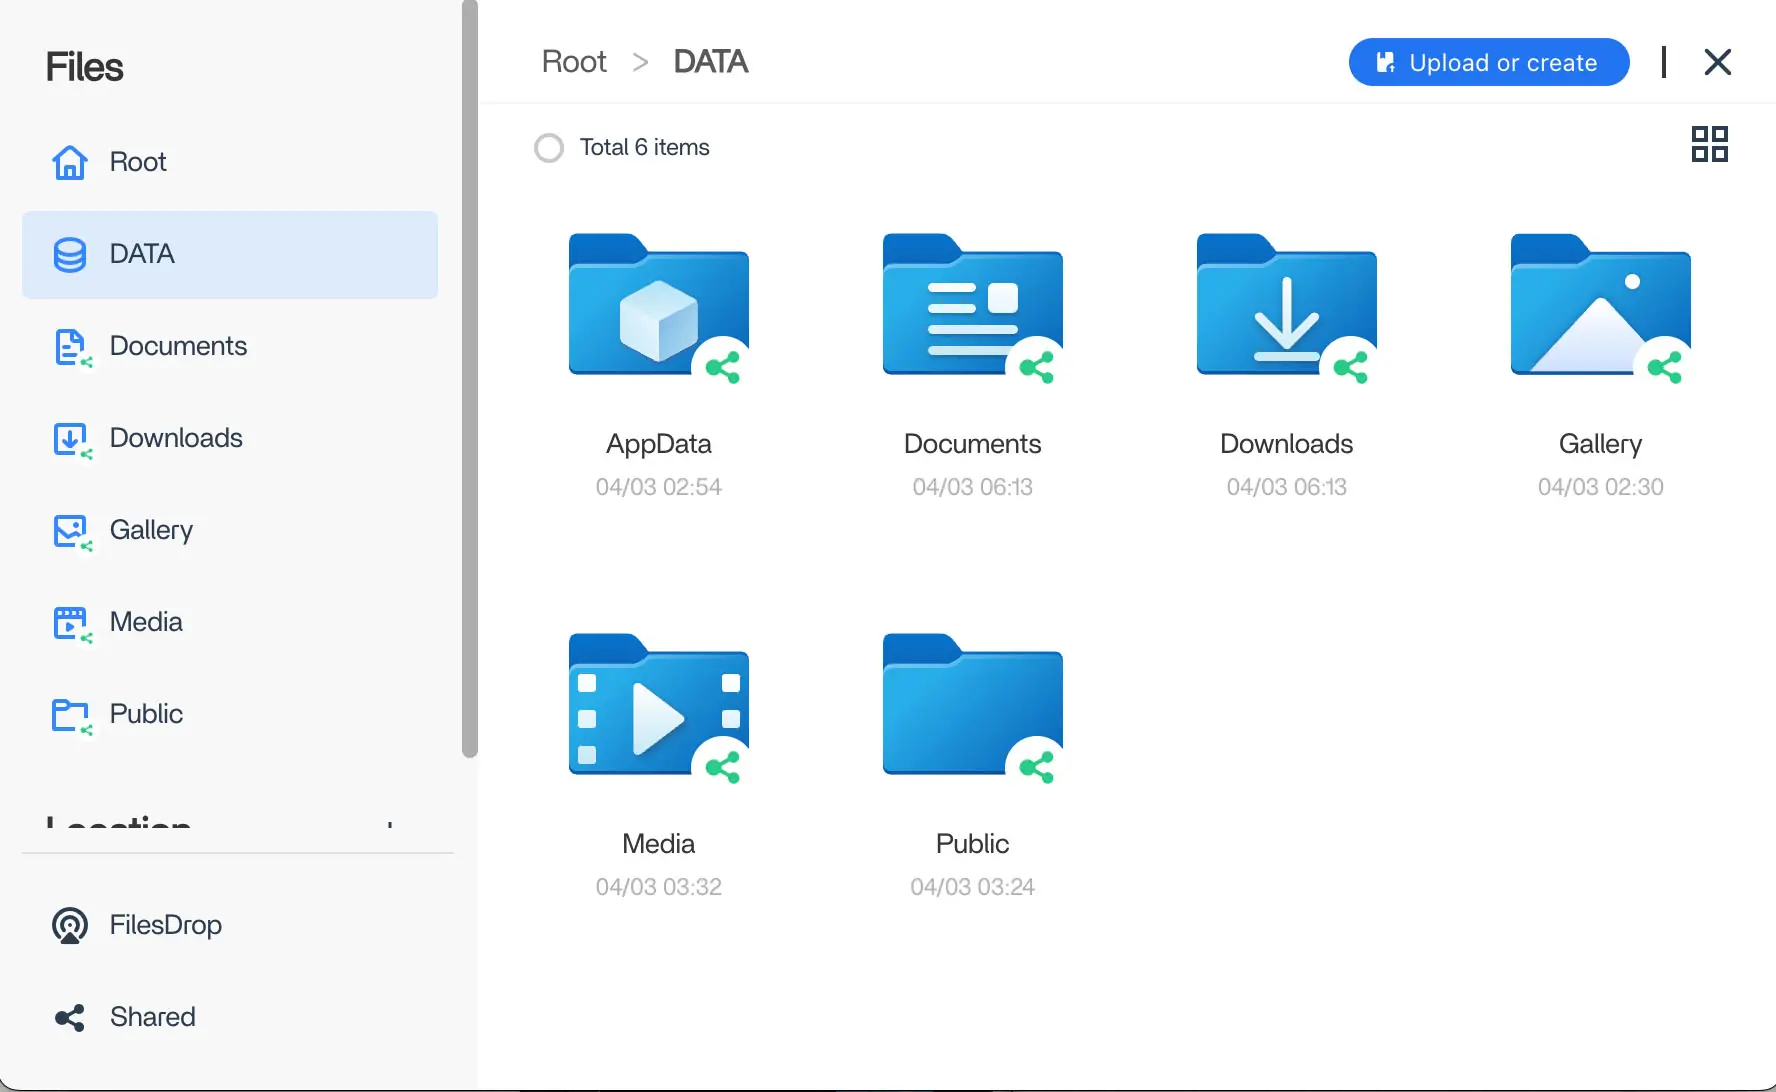
You can use the Files app in CasaOS to share your folders on your network. These shares are not password-protected and can be viewed by anyone who can access your home network.
Password Protecting CasaOS Shared Folders
This can be done by manually configuring Samba file sharing in Linux.
First, set up and share all of your main folders in CasaOS. This is necessary as adding extra shared folders will overwrite the changes we will make here.
Next, we must create a user and set a password for file sharing. The commands below will create a user called shareuser and set a password for the user.
$ sudo adduser --no-create-home --disabled-password \
	--disabled-login shareuser
$ sudo smbpasswd -a shareuser
The second command prompts you to enter a password to access protected shared folders. The CasaOS Terminal can filter certain characters in your password. It is best to run these commands via SSH from another computer.
Now, we can turn on password protection for our shared folders by editing /etc/samba/smb.casa.conf using the following command.
$ sudo nano /etc/samba/smb.casa.conf
You can protect each share by modifying the lines shown in bold in the example below for the share.
[Media]
comment = CasaOS share Media
public = No
path = /DATA/Media
browseable = Yes
read only = Yes
guest ok = No
valid users = shareuser
write list = shareuser
create mask = 0777
directory mask = 0777
force user = root
When you are done making the changes, run the following command to apply your changes.
$ sudo service smbd restart
Your shared folders are now password-protected. When accessing them from your Mac or Windows PC, you will be prompted to enter your user name, which is shareuser. You will also need to enter the password that you set.
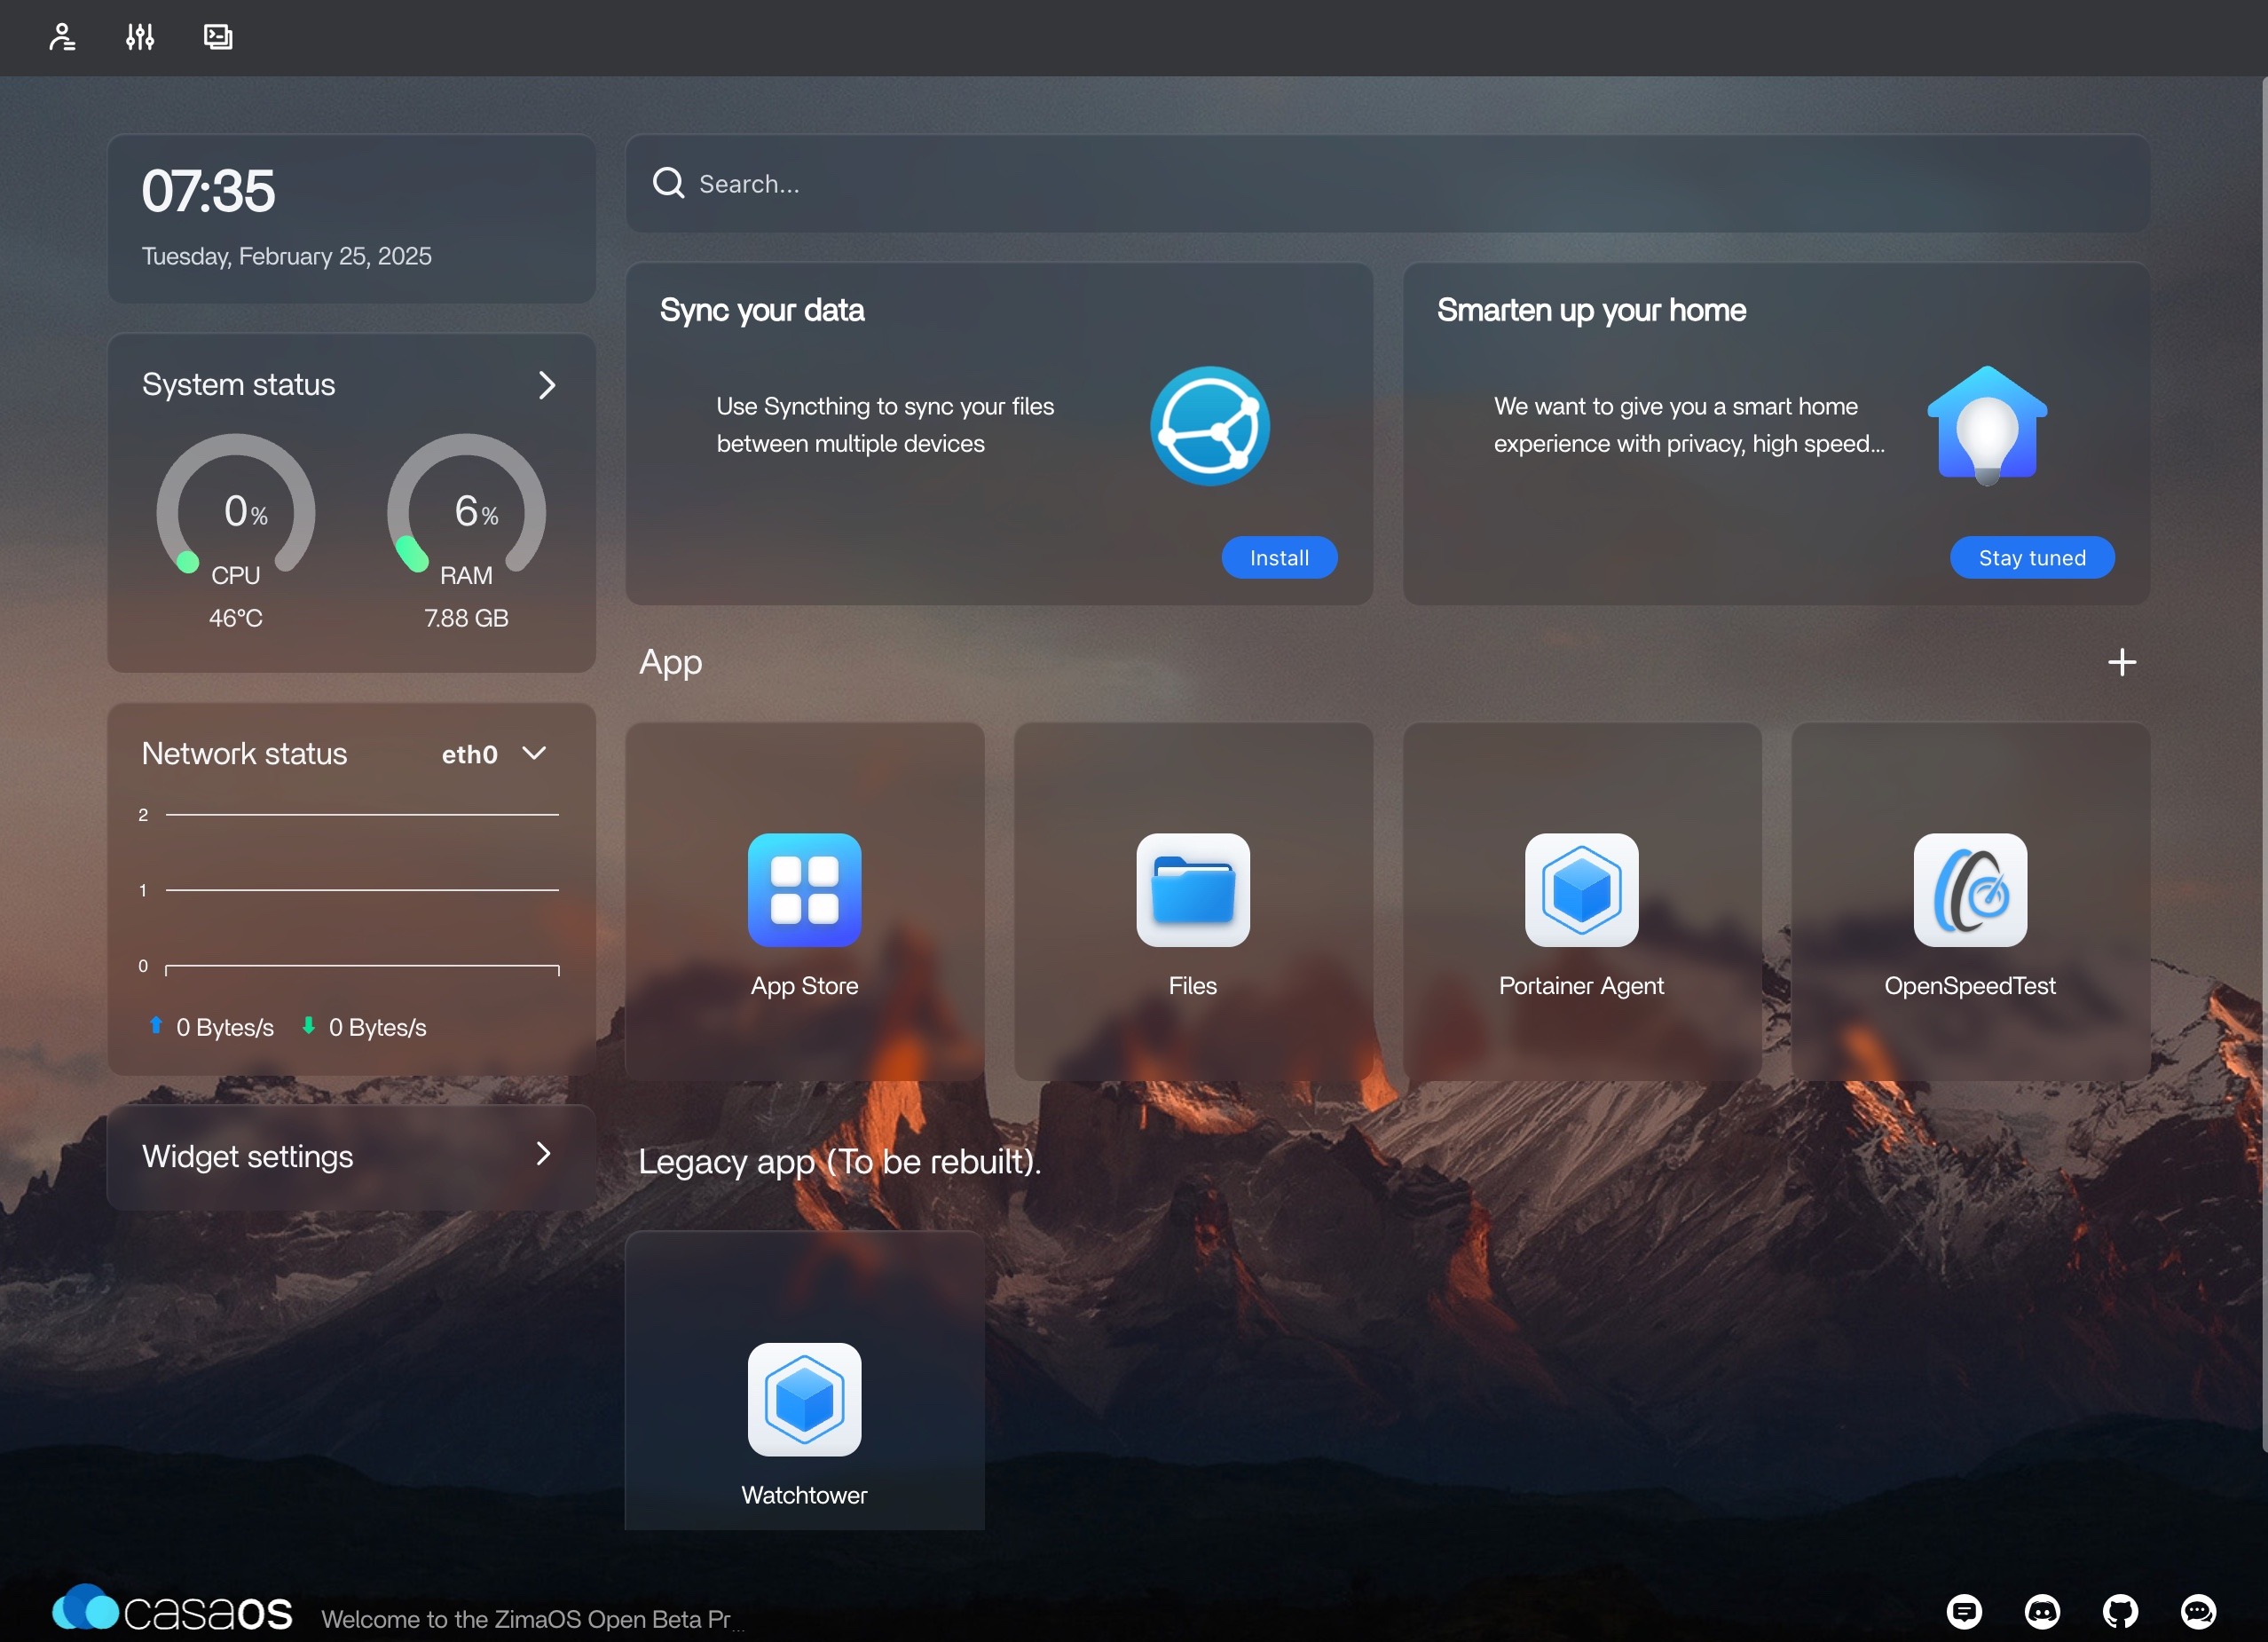
A First Application – OpenSpeedTest
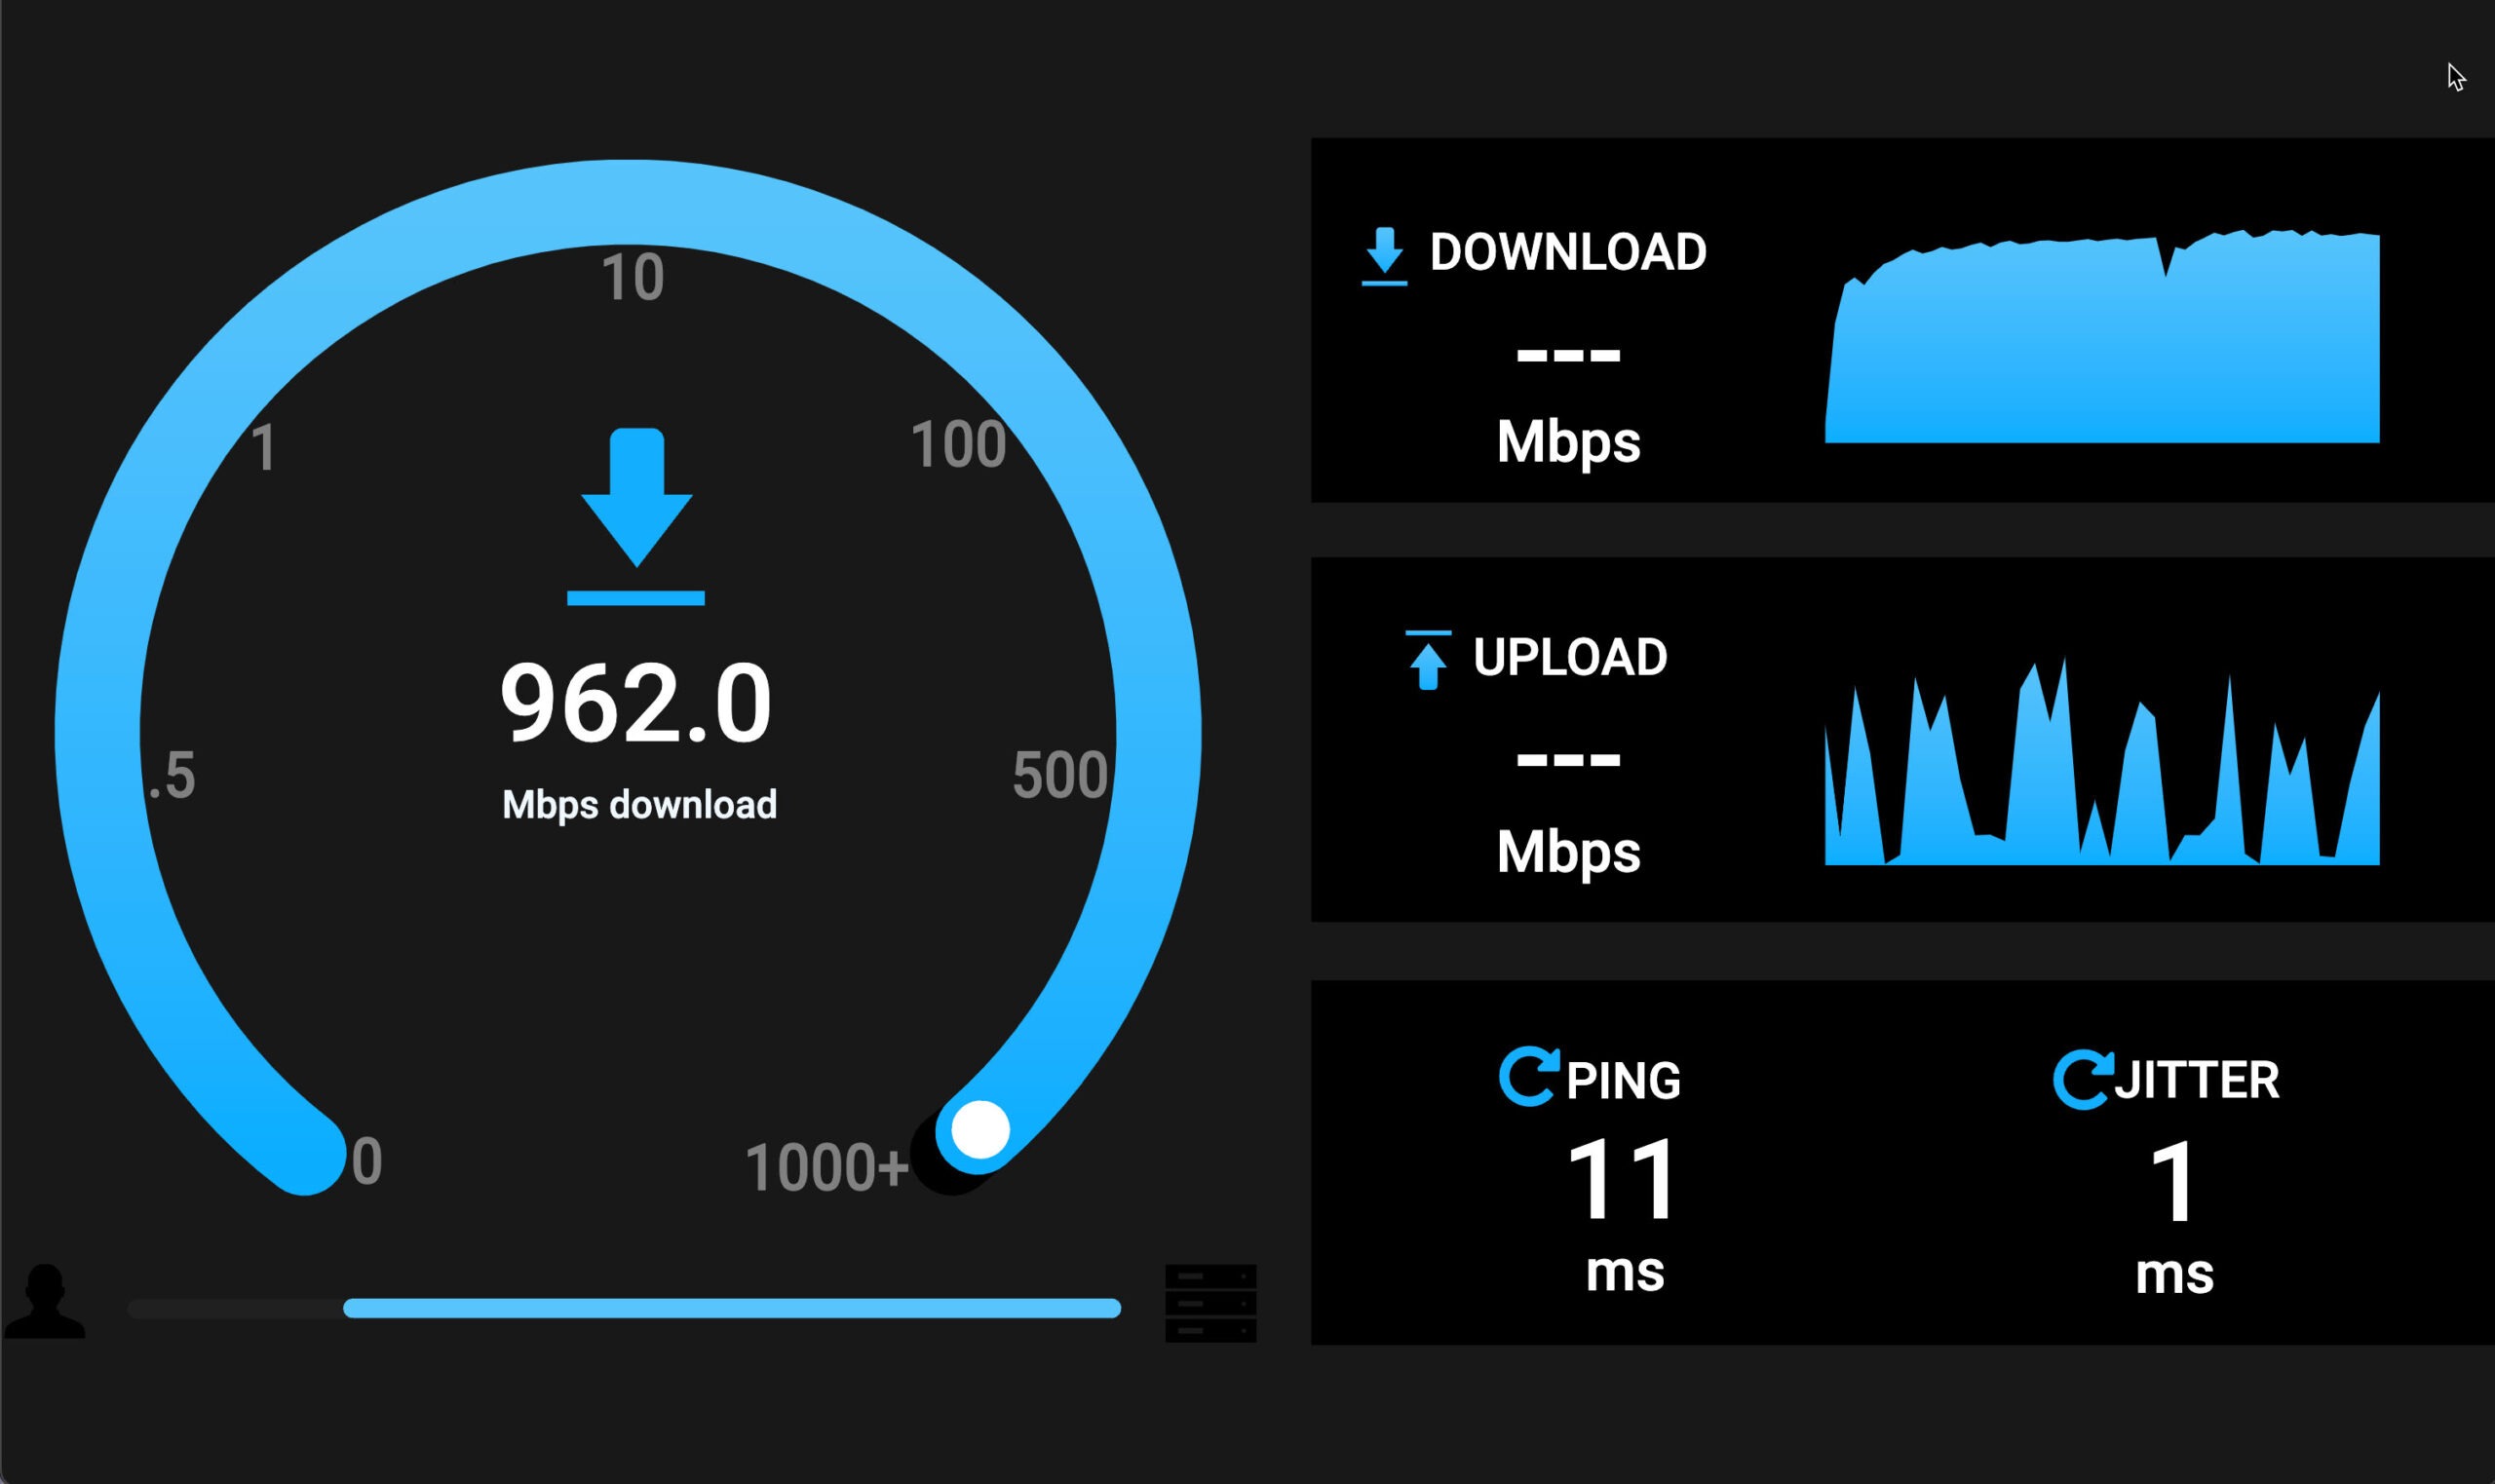
We’ll use the CasaOS App Store to install a simple speed test application called OpenSpeedTest on our home server. We’ll use the Utilities version of this app.
Once our speed test is installed, we can run it using the icon in the CasaOS dashboard or from any web browser on our home network using the following URL –
http://<you server IP>:3004
OpenSpeedTest runs as a container inside Docker on your Linux OS. Docker is beneficial for running applications without consuming much processing and memory resources. More about Docker follows.
Docker, Portainer, and Watchtower
We’ll use Docker to install and run applications on our home server. Docker provides an efficient environment to host applications. We’ll use Docker Compose to set up our applications to run in Docker.
Portainer
We’ll install an application called Portainer from the CasaOS app store next.
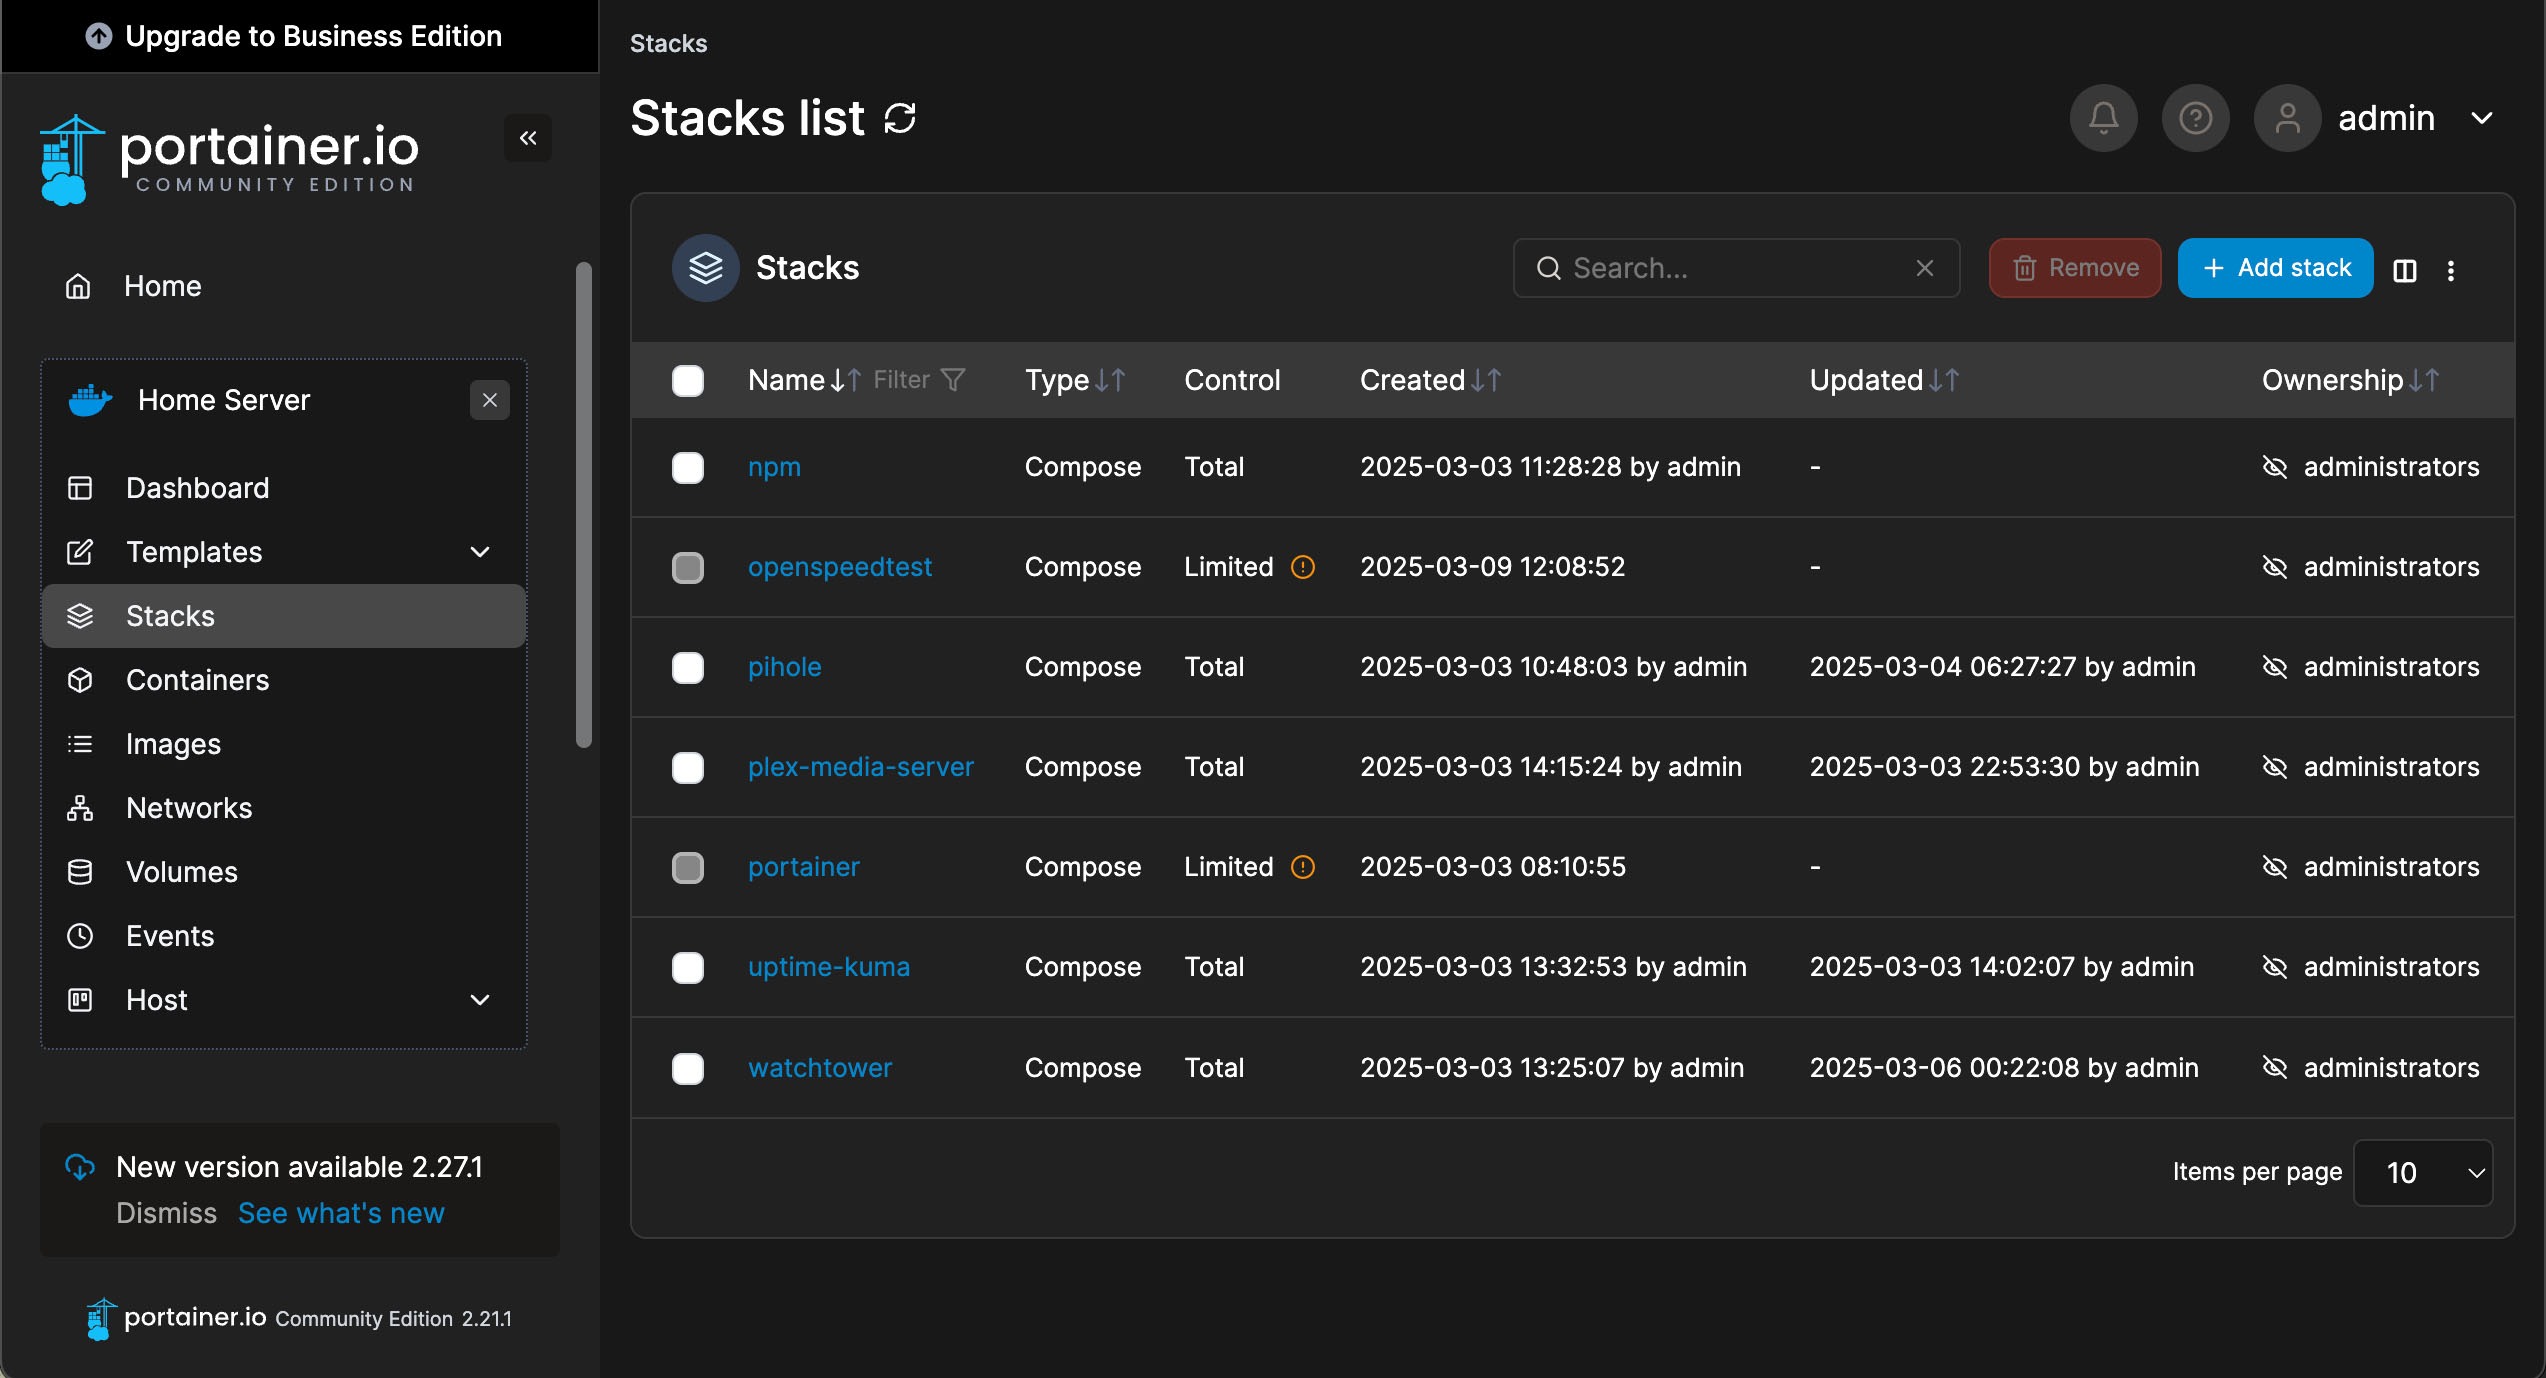
Portainer provides a graphical user interface (GUI) that makes using Docker much easier. So, we’ll use Portainer to install and manage all the Apps on our home server.
Watchtower – Automatic Checks for Container Updates

Next, we’ll install a container called Watchtower. Watchtower will periodically check for updated versions of all of our Docker images.
Here is a template Docker Compose file for installing Watchtower using a Stack in Portainer.
# Watchtower – check for container image updates
services:
    watchtower:
        container_name: Watchtower
        image: containrrr/watchtower:latest
        security_opt:
            - no-new-privileges:true
        volumes:
            - /var/run/docker.sock:/var/run/docker.sock

        # Restart on crashes and reboots
        restart: unless-stopped

        # Configure the container
        environment:
            # Set Timezone
            - TZ=America/New_York

            # Cleanup old images
            - WATCHTOWER_CLEANUP=true

            # Monitor only - disable auto updates
            - WATCHTOWER_MONITOR_ONLY=true

            # Set schedule to run at 5 am daily
- WATCHTOWER_SCHEDULE=0 0 5 * * *If Watchtower finds any updates, it will leave unused images for the associated containers in the Images section of Portainer. Specifically, to update a Container, you re-create it using the latest image. Afterward, you can remove the old unused images for the updated containers, as they will no longer be needed.
Configuring Your Domain On Cloudflare

You should already have purchased a domain on Cloudflare as part of completing the prerequisites for this project. Afterward, we’ll set up a Dynamic DNS service on our home server. This will keep the IP address for our Internet connection current and hidden in our Cloudflare DNS.
We’ll use a Cloudflare DDNS container to do this. The steps are –
- Obtain an API token on Cloudflare to allow our container to edit our domain’s DNS records on Cloudflare
- Next, we’ll paste our token into our Docker Compose for our container. We’ll deploy our container as a stack in Portainer. Refer below for a template Docker Compose file.
- Finally, we’ll log in to Cloudflare and check that our Internet IP address is correct.
# Cloudflare DDNS: set IP address for your domain on Cloudflare
services:
  cloudflare-ddns:
    image: oznu/cloudflare-ddns:latest
    restart: unless-stopped
    container_name: Cloudflare-DDNS-Update
    security_opt:
      - no-new-privileges:true

    environment:
      - API_KEY=<Your API key from Cloudflare goes here>
      - ZONE=<Your domain name goes here>
      - PROXIED=true

      # Check for IP changes every 5 minutes
- CRON=*/5 * * * *PiHole DNS Server
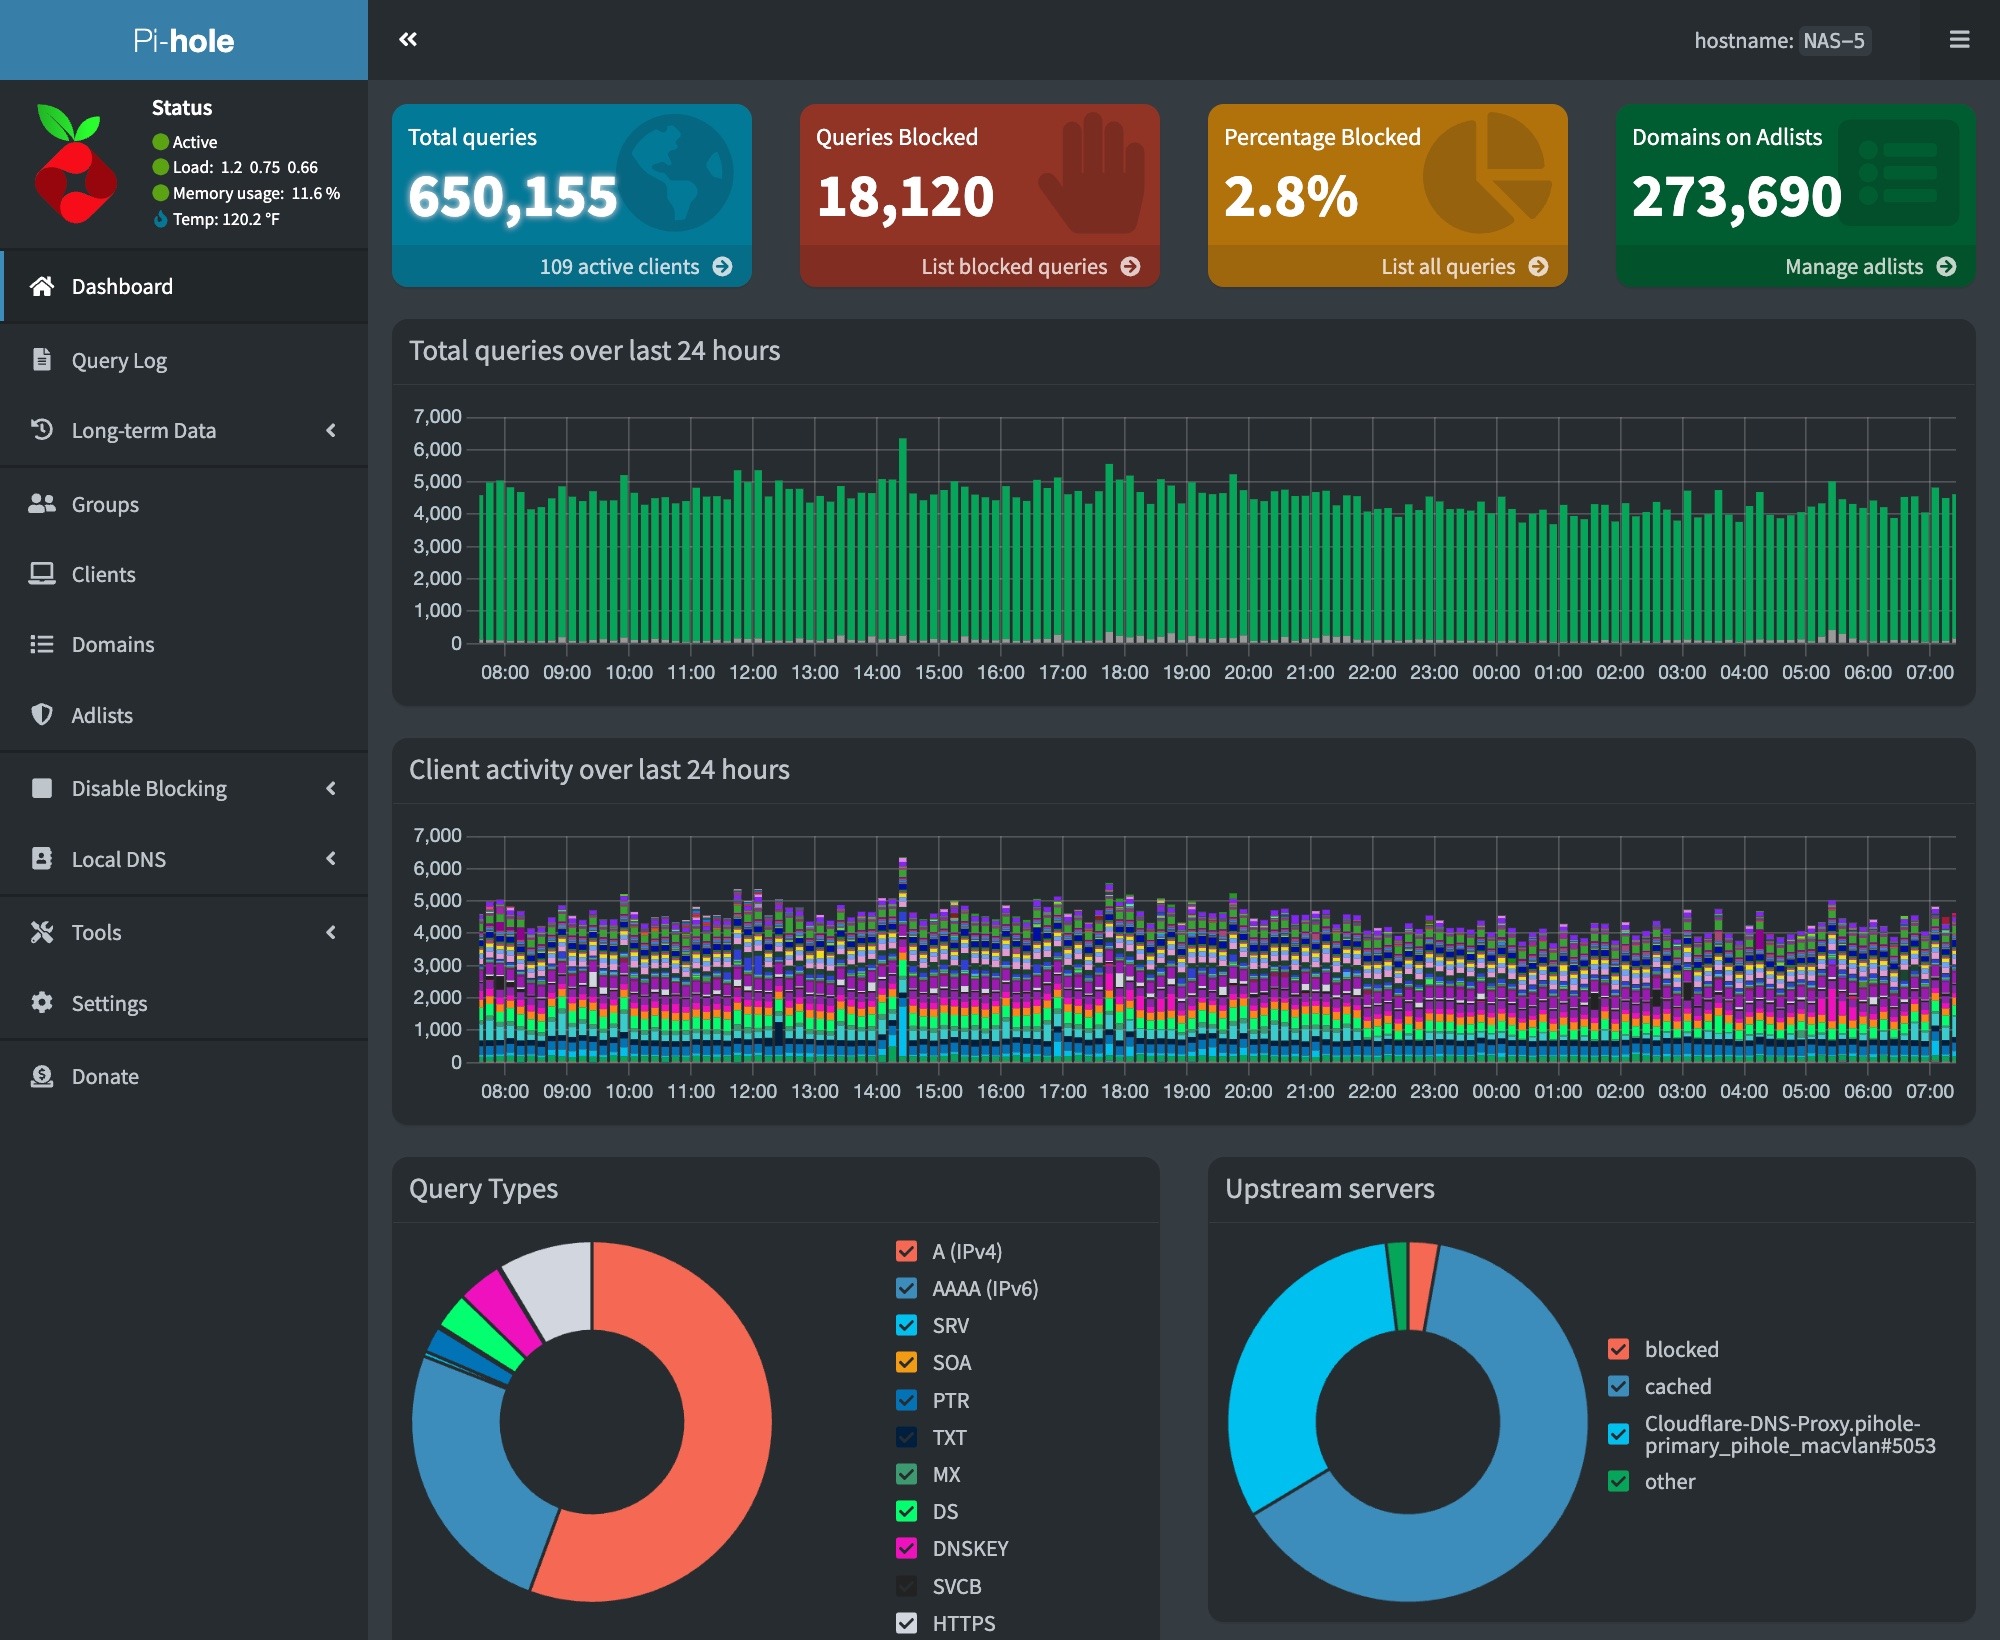
Next, we’ll set up PiHole as an ad-blocking DNS server for our home network. We’ll also use an encrypted tunnel between our PiHole server and Cloudflare to keep our web browsing activities private.
We’ll deploy PiHole by creating a Stack in Portainer using the Docker Compose template below.
# Deploy PiHole with an encrypted tunnel to Cloudflare
services:
  cloudflared:
    container_name: cloudflared
    image: cloudflare/cloudflared:latest
    security_opt:
      - no-new-privileges:true

    # Restart on crashes and reboots
    restart: unless-stopped

    # Cloudlflare tunnel used in proxy DNS mode
    command: proxy-dns

    environment:
      # Use standard Cloudflare DNS servers for Internet
      - "TUNNEL_DNS_UPSTREAM=https://1.1.1.1/dns-query,https://1.0.0.1/dns-query"

      # Listen on an unprivileged port
      - "TUNNEL_DNS_PORT=5053"

      # Listen on all interfaces
      - "TUNNEL_DNS_ADDRESS=0.0.0.0"

    # Attach Cloudflared only to the private network
    networks:
      pihole_internal:
        ipv4_address: 172.70.9.2

  pihole:
    container_name: pihole
    image: pihole/pihole:latest
    hostname: pitech-pihole
    security_opt:
      - no-new-privileges:true

    # Restart on crashes and reboots
    restart: unless-stopped

    # Set external ports for PiHole access
    ports:
      - "53:53/tcp"
      - "53:53/udp"
    # - "67:67/udp"
      - "500:80/tcp"
    # - "443:443/tcp"

    # Attach PiHole to the private network
    networks:
      pihole_internal:
        ipv4_address: 172.70.9.3

    environment:
      # Set local timezone
      TZ: 'America/New_York'

      # Substitute your strong password
      FTLCONF_webserver_api_password: '<your pihole dashboard password goes here>'
      FTLCONF_webtheme: 'default-dark'
      FTLCONF_dns_upstreams: '172.70.9.2#5053'    # Use Cloudflared tunnel
      FTLCONF_dns_listeningMode: 'all'
      FTLCONF_dns_dnssec: 'true'

    # Volumes stores your PiHole settings
    volumes:
      - '/DATA/AppData/pihole/:/etc/pihole/'

    # Make sure Cloudflare tunnel is up before PiHole
    depends_on:
      - cloudflared

# Create the internal private network
networks:
  pihole_internal:
     ipam:
       config:
         - subnet: 172.70.9.0/29.   # Allows for 4 IP addresses on network
     name: pihole_internal
Once our PiHole stack is up and running, we can access our PiHole dashboard via our web browser using the URL below –
http://<your server IP>:500/admin/
You’ll want to set up A and CNAME records for your IP devices and services. You will also need a DNS A Record to point at your new server: server-name.your-domain.
Hence, we will change the DHCP setup in your router to make your network’s DNS IP your PiHole server.
Reverse Proxy Using Nginx Proxy Manager
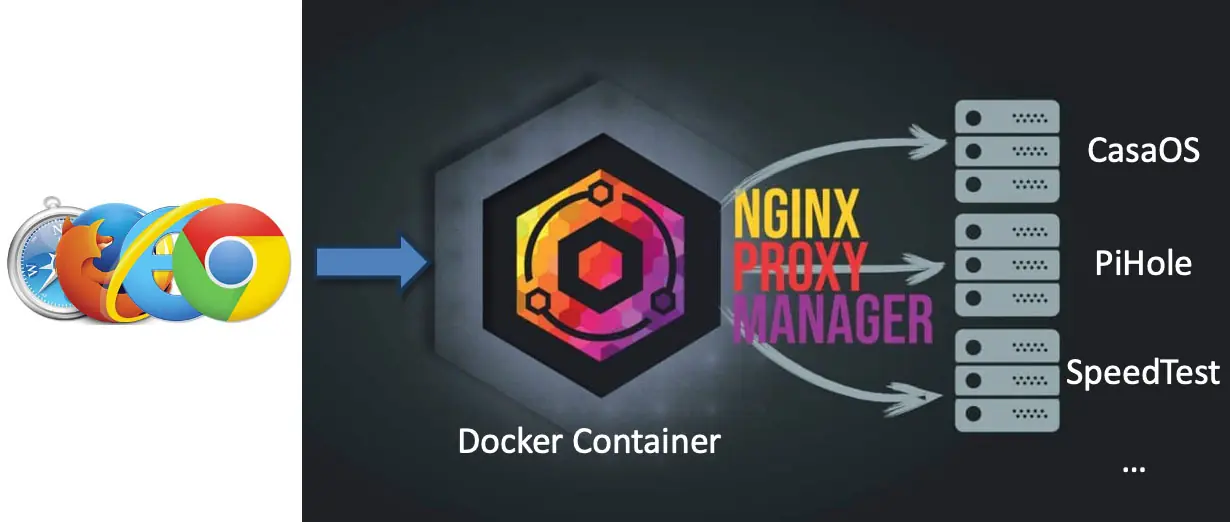
Next, we’ll set up Nginx Proxy Manager (NPM). NPM will offer several valuable services for us, including –
- The ability to use subdomain names for our services and automatically add the correct port numbers for our hosted services
- We will obtain a signed wildcard SSL certificate for our domain from Let’s Encrypt. This certificate will allow secure web connections (https) for our services. NPM will use a DNS-01 Challenge to obtain our SSL certificate. This way, we won’t have to open any ports to the Internet.
We can use the Docker Compose template below to deploy Nginx Proxy Manager in Portainer.
# Nginix Proxy Manager: Reverse Proxy
services:
  app:
    image: 'jc21/nginx-proxy-manager:latest'
    restart: unless-stopped
    security_opt:
      - no-new-privileges:true

    # Internal network for communicating with the database
    networks:
      - proxy

    # Expose ports to the outside world
    ports:
      - '80:80'
      - '81:81'    # For configuration GUI
      - '443:443'

    environment:
      DB_MYSQL_HOST: 'db'
      DB_MYSQL_PORT: 3306
      DB_MYSQL_USER: 'npm'
      DB_MYSQL_PASSWORD: '<your DB password>'  # Replace with a strong password
      DB_MYSQL_NAME: 'npm'

    # Persistent storage for npm configuration and SSL certs
    volumes:
      - /DATA/AppData/nginx-proxy-mgr/data:/data
      - /DATA/AppData/nginx-proxy-mgr/letsencrypt:/etc/letsencrypt

  db:
    image: 'jc21/mariadb-aria:latest'
    restart: unless-stopped
    security_opt:
      - no-new-privileges:true

    # Join the internal network
    networks:
      - proxy

    environment:
      MYSQL_ROOT_PASSWORD: '<your DB password>' # Replace with the same strong password
      MYSQL_DATABASE: 'npm'
      MYSQL_USER: 'npm'
      MYSQL_PASSWORD: '<your DB password>'      # Replace with the same strong password

    # Persistent storage for the configuration database
    volumes:
      - /DATA/AppData/nginx-proxy-mgr/mysql:/var/lib/mysql

# Define the private internal network
networks:
  proxy:
    name: npm_proxy
Configuring Nginx Proxy Manager
The video above covers the configuration of NPM. We can use the same Cloudflare API token we obtained for the DDNS Service to create our SSL certificate.
We can now set up our apps to use NPM and our SSL domain’s wildcard SSL certificate. Additionally, the steps to add a Proxy Host for each service in NPM are as follows –
- Set up a subdomain for the service in PiHole
- Set up a service proxy host in NPM using:
- Your Server IP and the port for your Service
- Also, set the options to Block Common Exploits and turn on WebSockets Support.
- Next, apply your domain’s SSL certificate and Force SSL to be used
- Finally, use HTTP/2 (except for OpenSpeedTest) and turn on HSTS and HSTS sub-domain support.
Backups Using Duplicati
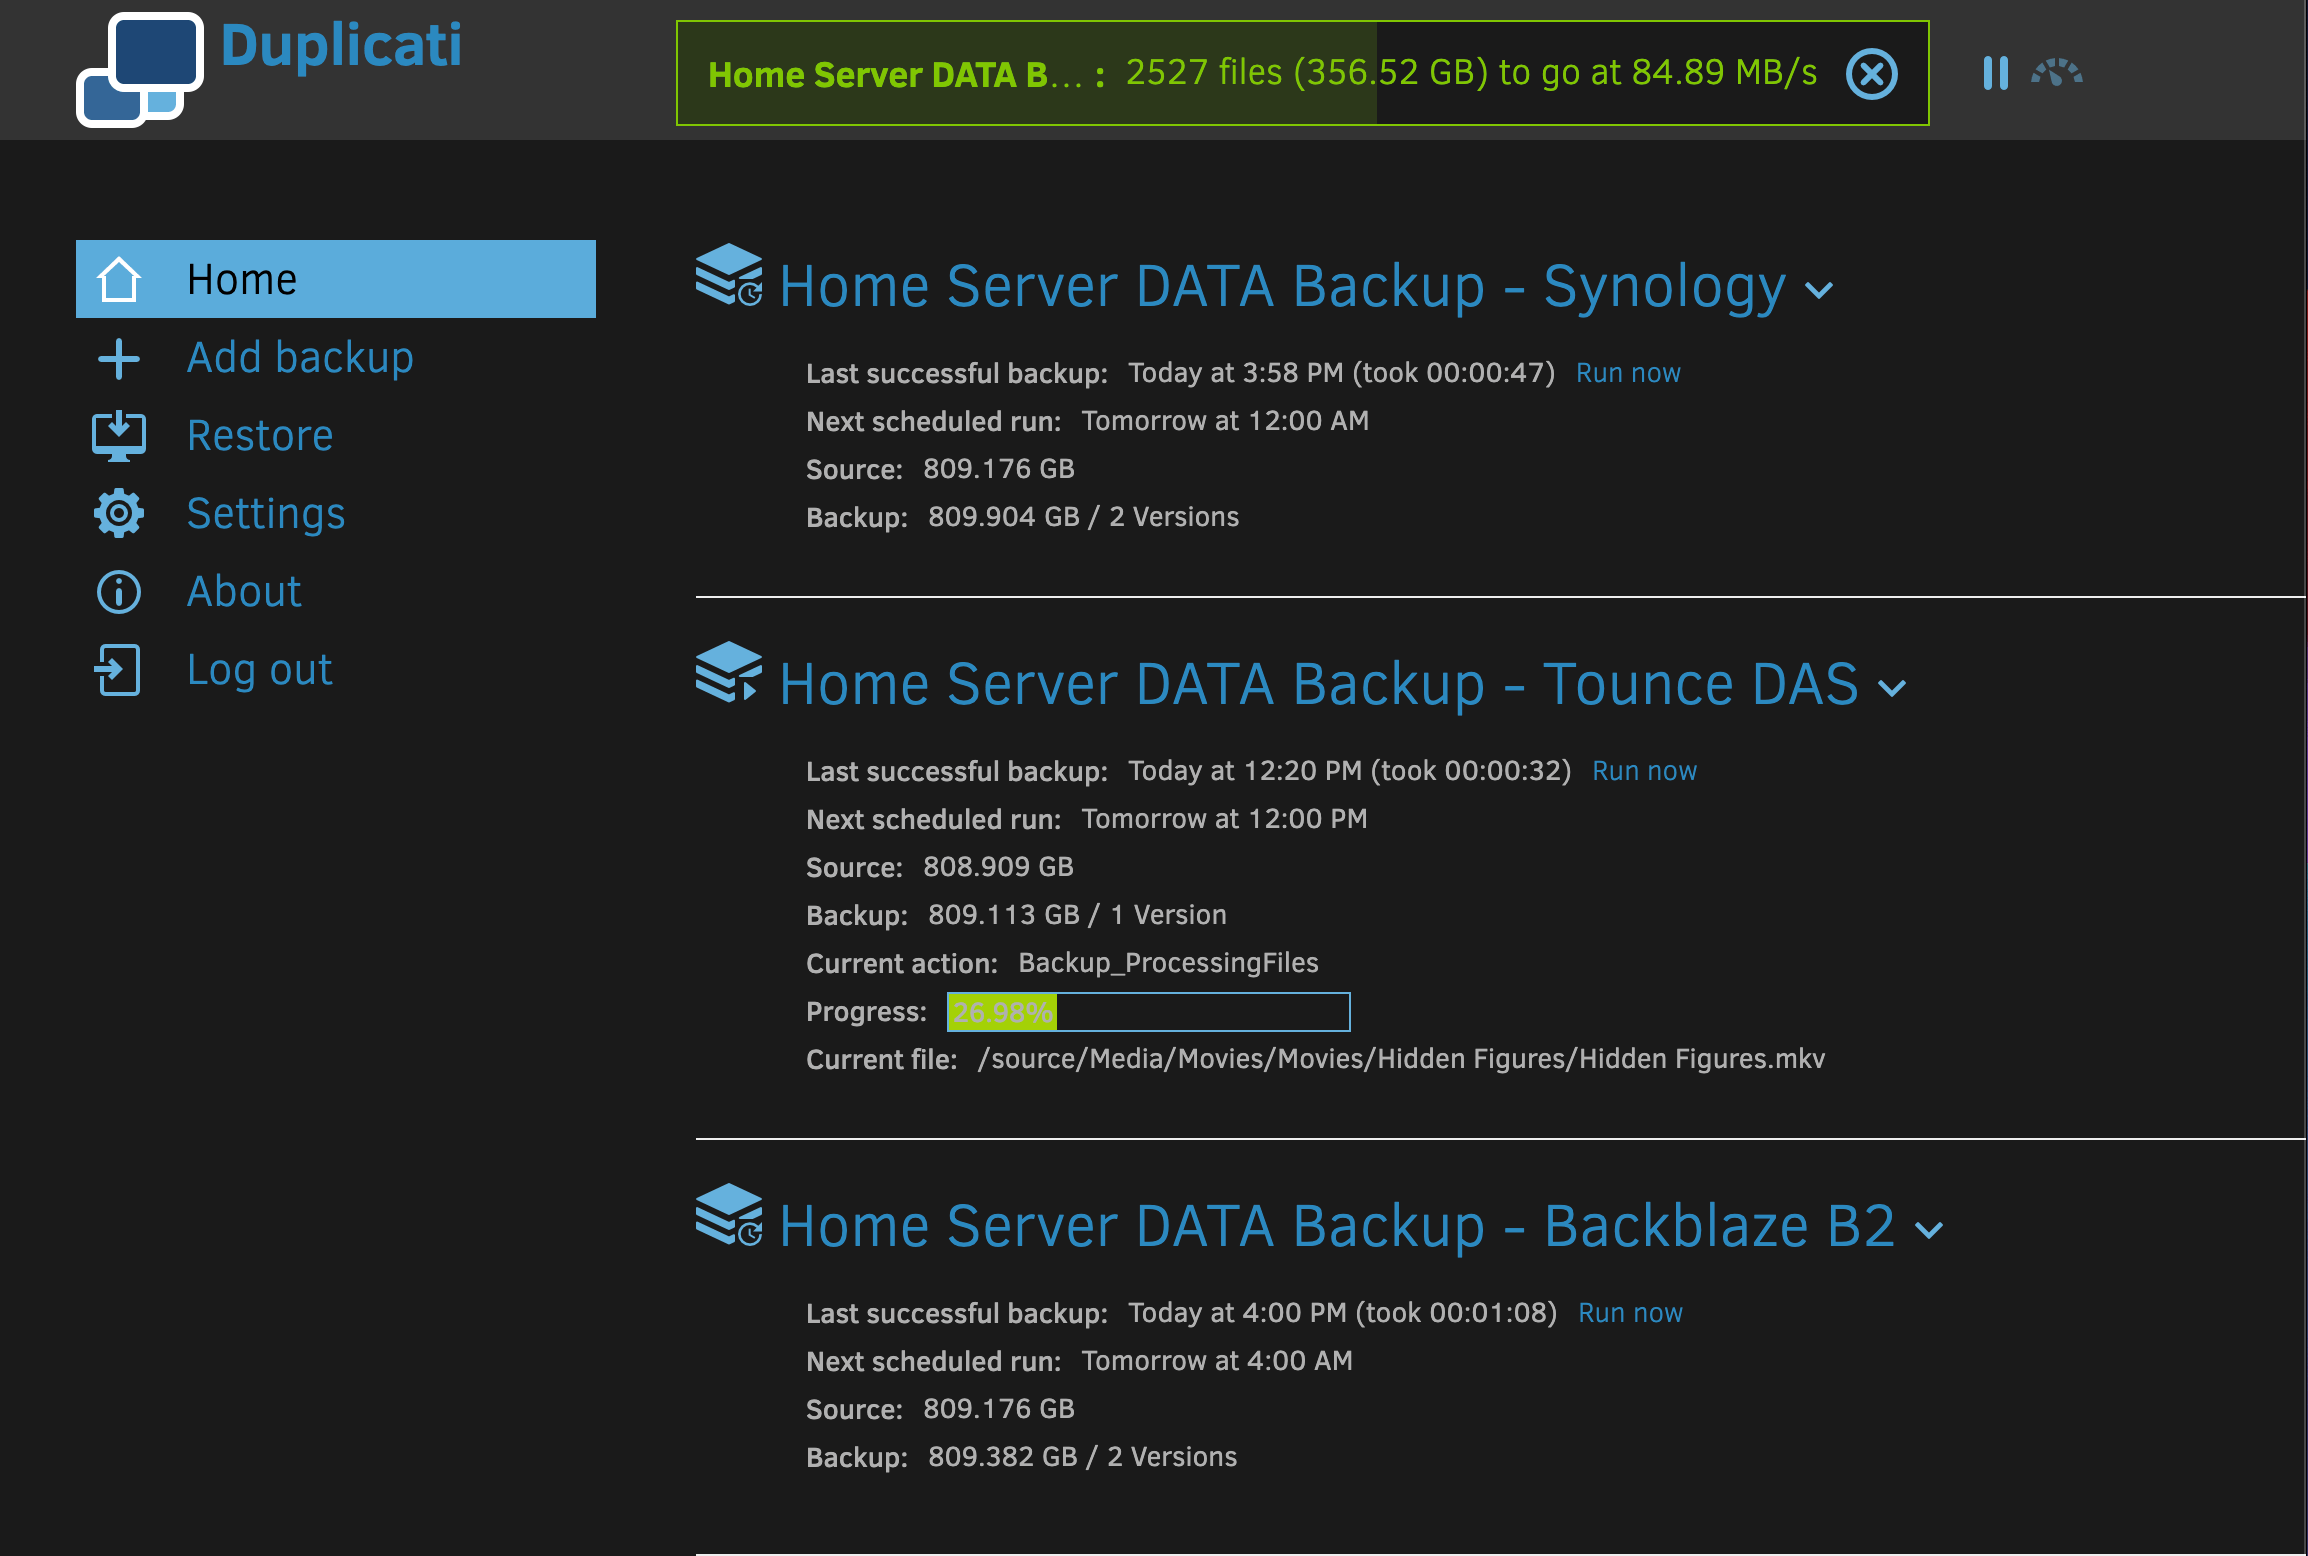
We can use the Duplicati Backup app. It allows us to back up the data stored on our Raspberry Pi Home Server and configuration information. As a result, we have a backup solution that provides deduplication and encrypted backups. It offers a variety of local, network, and cloud backup destinations.
Duplicati can be deployed as a Portainer Stack using the following template.
# Duplicati: backup files and folders to a variety of stores
services:
  duplicati:
    image: lscr.io/linuxserver/duplicati:latest
    container_name: duplicati
    restart: unless-stopped
    security_opt:
      - no-new-privileges:true

    # Set the port for GUI access
    ports:
      - 8200:8200

    environment:
      - PUID=1000
      - PGID=1000

      # Set local timezone
      - TZ=America/New_York

      # Choose a default for encryption - replace it with a strong key
      - SETTINGS_ENCRYPTION_KEY='<replace with your strong key>'

      # Can add args when this container is launched
      - CLI_ARGS= #optional

      # Initial password will be 'changeme' if left blank
      - DUPLICATI__WEBSERVICE_PASSWORD=

    # Set locations of sources for backups and destination stores
    volumes:
      # Location for configuration storage
      - /DATA/AppData/duplicati/config:/config

      # Location for local backup storage on this server
      - /Backups:/backups

      # Root folder for creating backups - Using CasaOS DATA directory
- /DATA:/sourceYou should create the /Backup directory in your Raspberry Pi Home Server using the CasaOS Terminal. The root user should own this directory and have access mode 777.
# Run these commands in the CasaOS Terminal

$ sudo mkdir /Backups
$ sudo chown root:root /Backups
$ sudo chmod 777 /Backups
Finally, a proxy host was set up in Nginx Proxy Manager and PiHole for Duplicati backup.
Steps To Perform a Backup
To back up your data and applications completely, a few steps are required.
- Backup your Docker Volume Data (only required when adding or changing application configuration).
- Make backups of your settings in PiHole and Portainer and store them in your Configs folder in CasaOS. This is only required when you change your PiHole DNS or Portainer’s configuration.
- Backup your Duplicati backup configurations (only required when you add or change the backups configured in Duplicati).
- Run a manual or scheduled backup using Duplicati.
Steps 1 – 3 above are only required when adding or reconfiguring applications. These steps apply to Duplicati backups and/or DNS records on your Home Server. Typically, you will run scheduled Duplicati backups. This will capture your data stored in CasaOS shares, including the configuration information that you saved via steps 1 – 3.
Docker Volume Data Backup
We want to include copies of the Docker volumes and configuration data for all our Apps in our backups. To do this, copy the scripts in this section to your home directory on your Home Server. Then, execute them remotely via SSH from your PC. Also, remember to make the scripts executable and run them as the root user.
Backup Script
#!/bin/bash
#
# bu-config.sh - Script to make .zip backups of all our
#    docker continer volume data folders. Backup .zip files
#    are stored in CasaOS Configs folder.
#
# usage: $ sudo bash ./bu-config.sh
#
# Note: This script must be executed remotely via SSH. Do not
#    use the CasaOS Terminal.

# Configuration
DATE_STR=`date +%F_%H-%M-%S%Z`
BACKUP_DIR="/DATA/Configs"
APP_DIR="AppData"
DOCKER_ROOT="/DATA/$APP_DIR"

# Make sure we are running as root
if [ "$EUID" -ne 0 ]
	then echo "Please run as root"
	exit 1
fi

# Make sure backup folder exists
if [ ! -d "$BACKUP_DIR" ]
then
	# Need to create the backup directory
	mkdir "$BACKUP_DIR"

	# Set owner, group, and mode - follow CasaOS standard
	chown root:root "$BACKUP_DIR"
	chmod 777 "$BACKUP_DIR"
fi

# Warn user not to run this script from the CasaOS Terminal
echo -e "\n*** WARNING: You cannot run this script using the CasaOS Terminal - use ssh from your PC insted ***"

# Confirm its OK to stop containers
echo -e "\n*** The following docker containers are running ***"
docker ps --format '{{.Names}} - {{.Status}}' | sed -e 's/^/    /'
read -p "OK to stop these containers (type yes to continue)? " resp
if [[ "$resp" != "yes" && "$resp" != "y" ]]
then
	echo ">>> Backup aborted <<<"
	exit 2
fi

# Stop all docker containers
echo -e "\n*** Stopping docker containers ***"
docker ps --format '{{.Names}} - {{.Status}}' | sed -e 's/^/    /'
docker stop $(docker ps -q) > /dev/null

# Create a backup and set owner/permissions for each folder
echo -e "\n*** Creating backups of Apps in $DOCKER_ROOT in $BACKUP_DIR ***"
cd $DOCKER_ROOT
for FOLDER in *
do
	# Skip files - folders only
	if [ -f $FOLDER ]
	then
		continue;
	fi

	# Backup filename and full pathname
	BACKUP_FILE=BU_"$FOLDER"_"$DATE_STR".zip	# Avoid problems mixing _ and $VAR
	BACKUP_PATH="$BACKUP_DIR/$BACKUP_FILE"

	# Create the backup
	echo -e "    Backing up $FOLDER to $BACKUP_PATH"
	zip -q -r "$BACKUP_PATH" $FOLDER

	# Set owner/permissions
	chown root:root "$BACKUP_PATH"
	chmod 766 "$BACKUP_PATH"

	# Show size of backup
	cd $BACKUP_DIR
	echo -e "    `du -h $BACKUP_FILE |  sed -e 's/\s\+/ - /g'`\n"
	cd $DOCKER_ROOT
done

# Handle files in docker root directory
BACKUP_FILE=BU_"$APP_DIR"_"$DATE_STR".zip	# Avoid problems mixing _ and $VAR
BACKUP_PATH="$BACKUP_DIR/$BACKUP_FILE"

# Create the backup
echo -e "    Backing up $APP_DIR files to $BACKUP_PATH"
cd $DOCKER_ROOT
zip -q $BACKUP_PATH *

# Set owner/permissions
chown root:root "$BACKUP_PATH"
chmod 766 "$BACKUP_PATH"

# Show size of backup
cd $BACKUP_DIR
echo -e "    `du -h $BACKUP_FILE |  sed -e 's/\s\+/ - /g'`\n"
cd $DOCKER_ROOT

# Start all docker containers
docker start $(docker ps -a -q) > /dev/null
echo -e "*** Started docker containers ***"
docker ps --format '{{.Names}} - {{.Status}}' | sed -e 's/^/    /'

# All done
exit 0We have developed a custom shell script (referenced above) that effectively terminates all running Docker containers. Then, it generates zip backups of each application’s Docker volumes. Finally, the script restarts all Docker containers. Additionally, it creates a new Configs folder within CasaOS. After executing the script initially, you should share this folder.
Example Execution
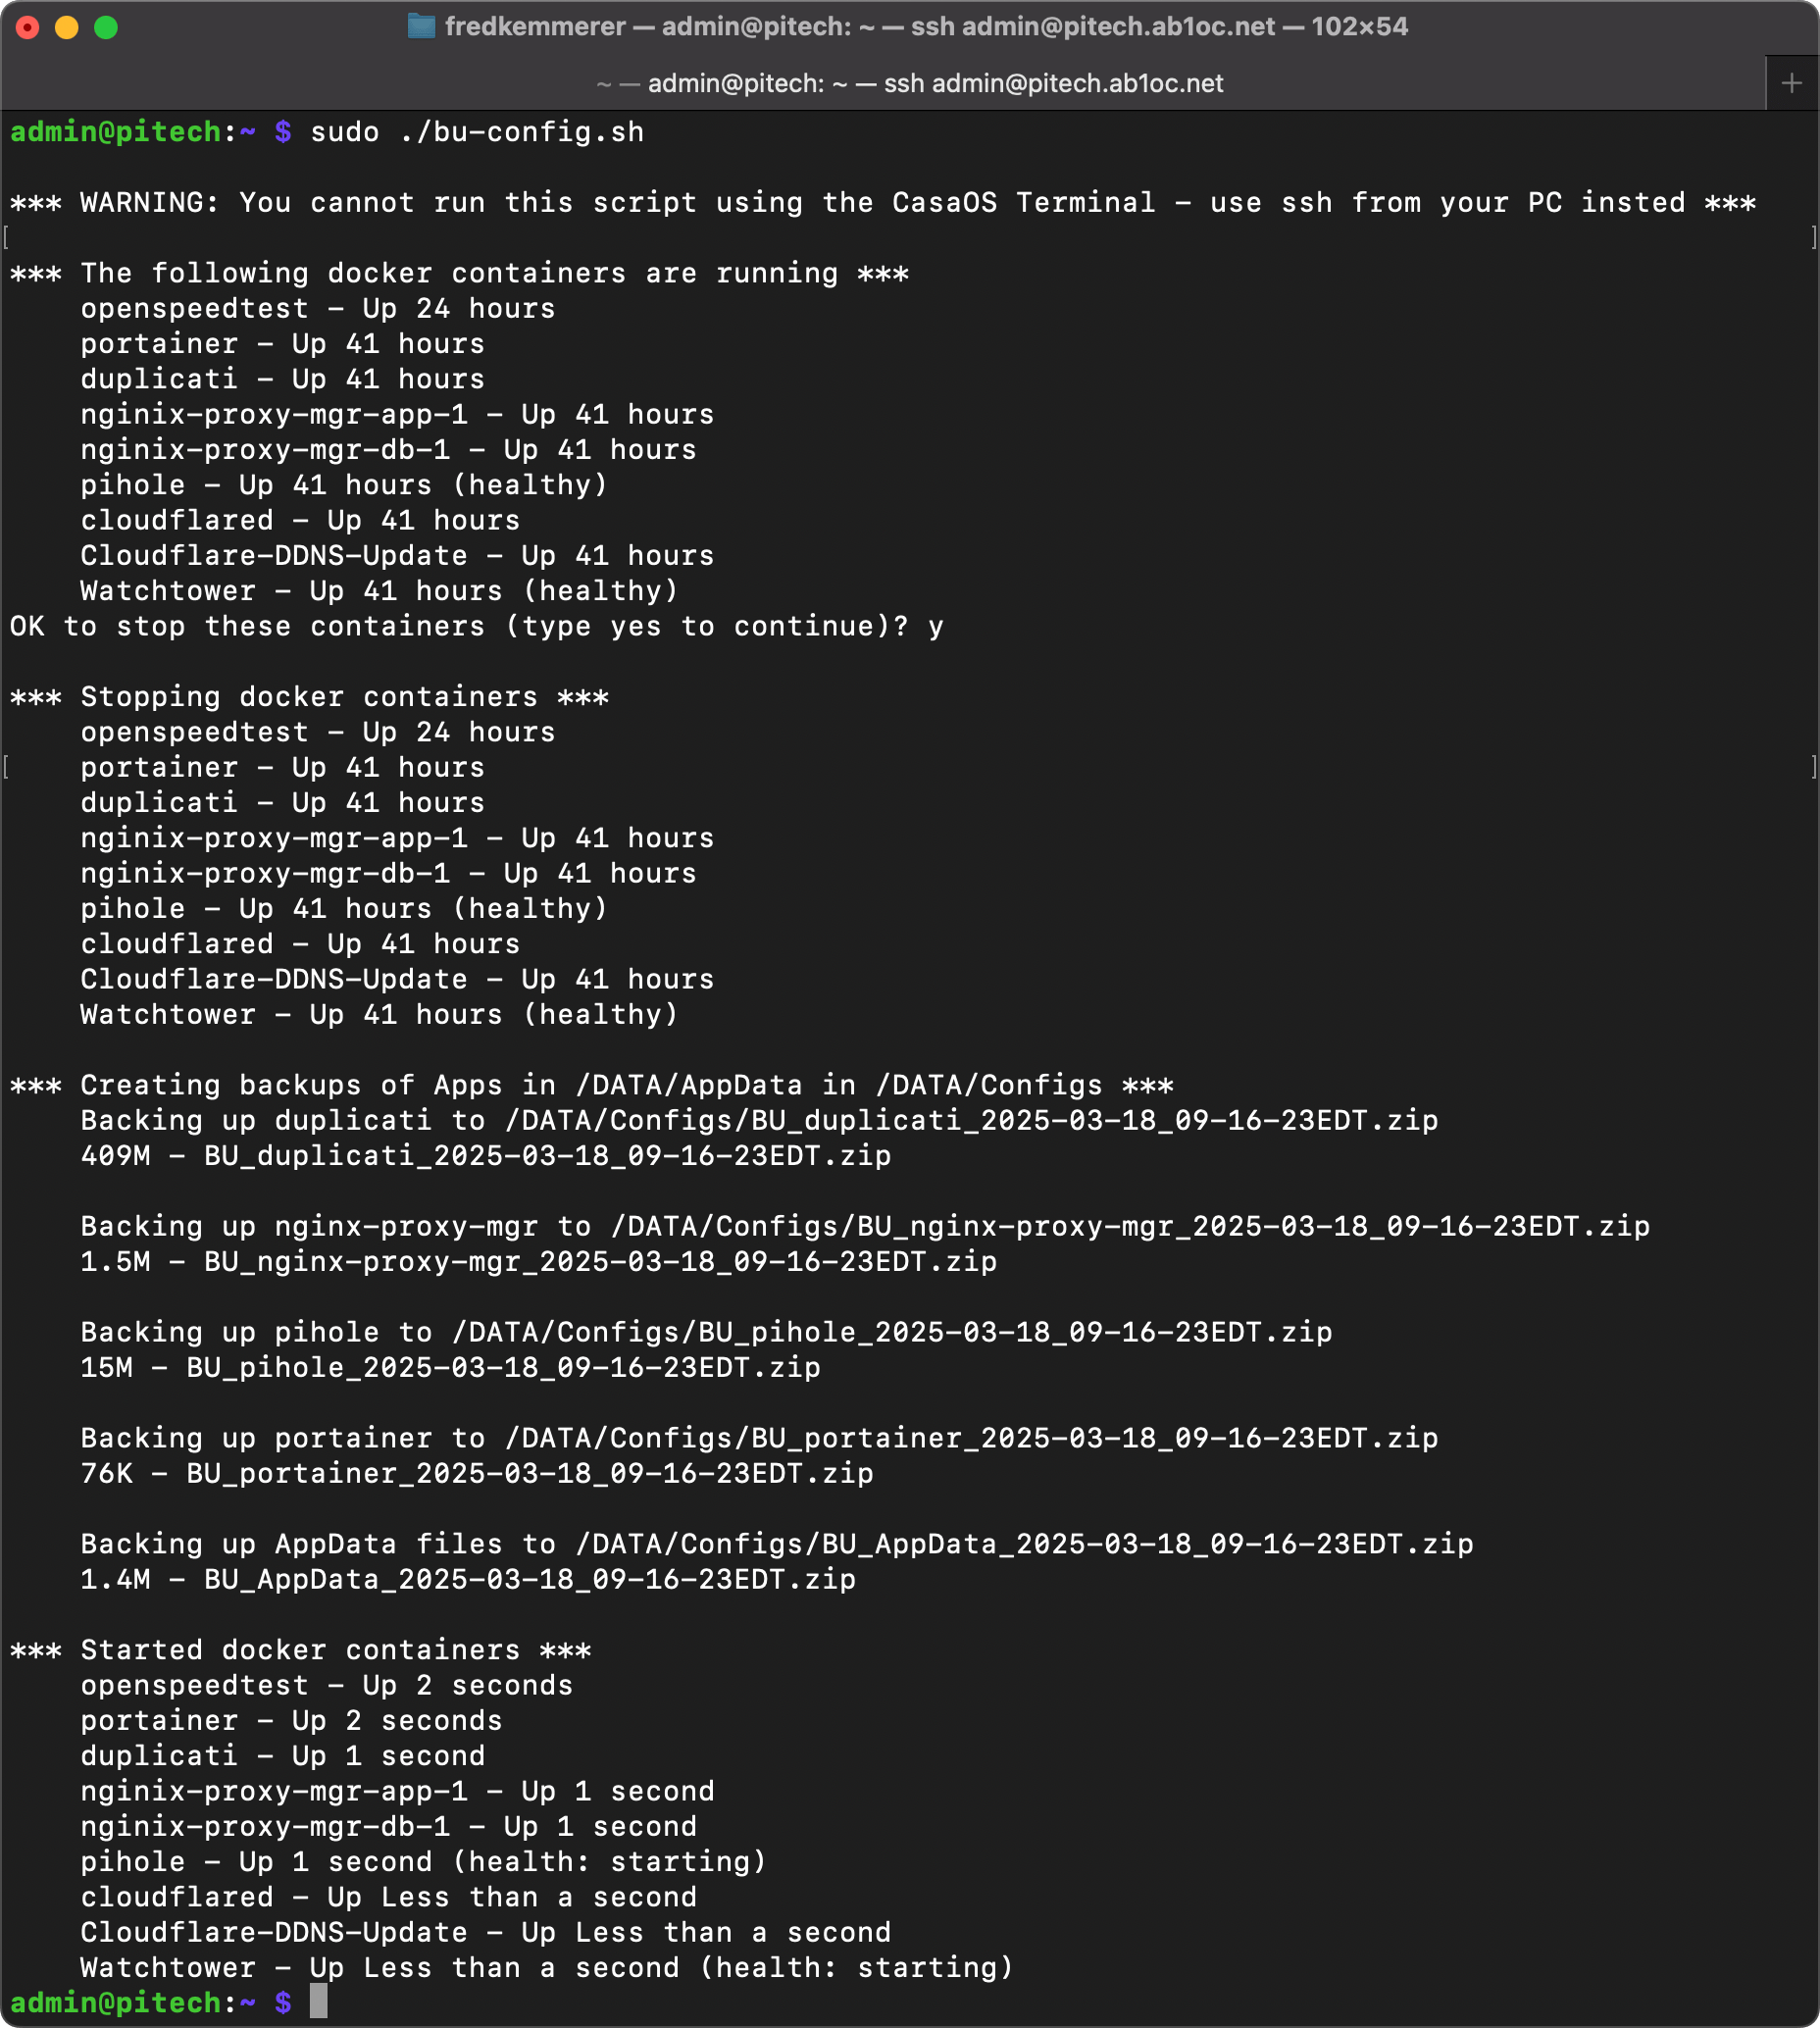
The above image shows an example of the script’s execution. You must run this script as the root user via SSH from a PC or external server. You can’t execute the script from the CasaOS Terminal.
Docker Recovery Script
The Docker backup script could fail, preventing your containers from being restarted. While this is unlikely, we’ve created the script below to restart your existing Docker containers.
#!/bin/bash
#
# restart-apps.sh - Script to restart Docker containers
#    if the backup script fails
#
# usage: $ sudo bash ./restart-apps.sh
#
# Note: This script must be executed remotely via SSH. Do not
#    use the CasaOS Terminal.
#

# Make sure we are running as root
if [ "$EUID" -ne 0 ]
	then echo "Please run as root"
	exit
fi

# Start all docker containers
docker start $(docker ps -a -q) > /dev/null
echo -e "*** Started docker containers ***"
docker ps --format '{{.Names}} - {{.Status}}' | sed -e 's/^/    /'

# All done
exit 0PiHole and Portainer Application Configuration Backup
PiHole, Portainer, and Duplicati have specific commands in their GUIs to back up their settings. You can use these to download backups to your PC. Then, move them to the CasaOS Configs folder for Duplicati to backup.
PiHole
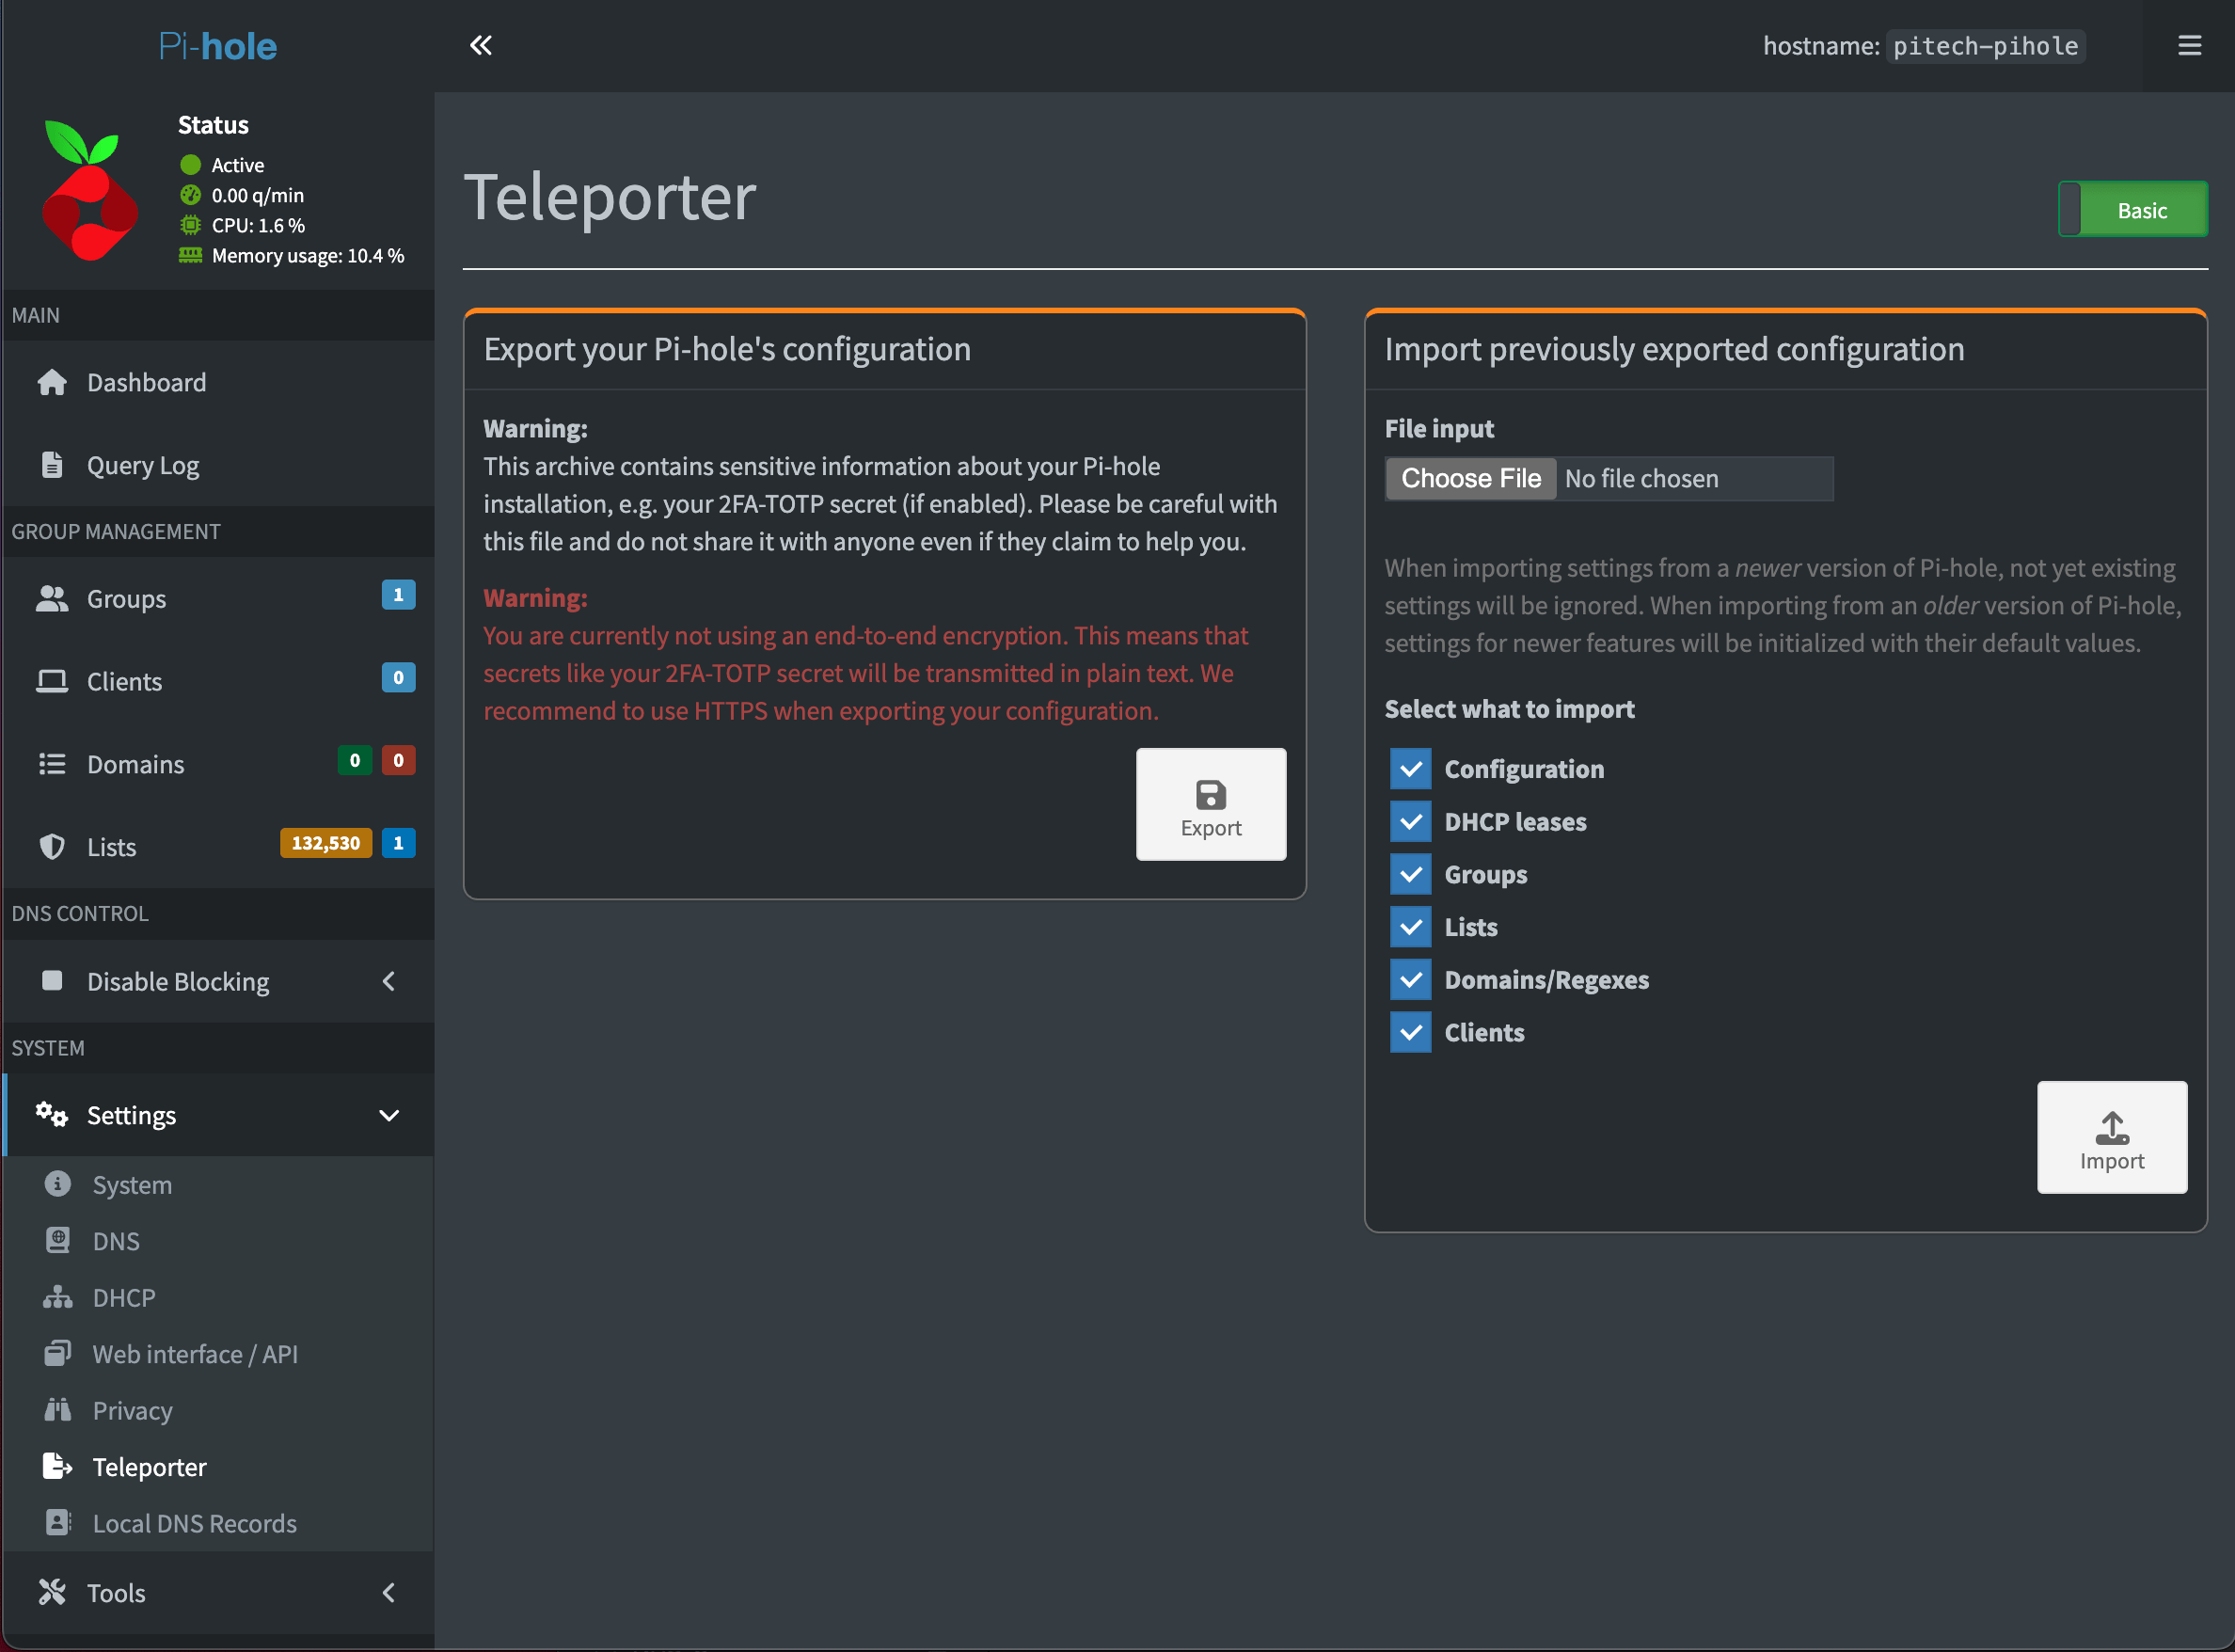
Using the Teleporter item under Settings, you can back up PiHole’s entire configuration, including all your custom DNS records. After downloading the backup to your PC, move it to the CasaOS Configs folder for Duplicati to backup.
Portainer
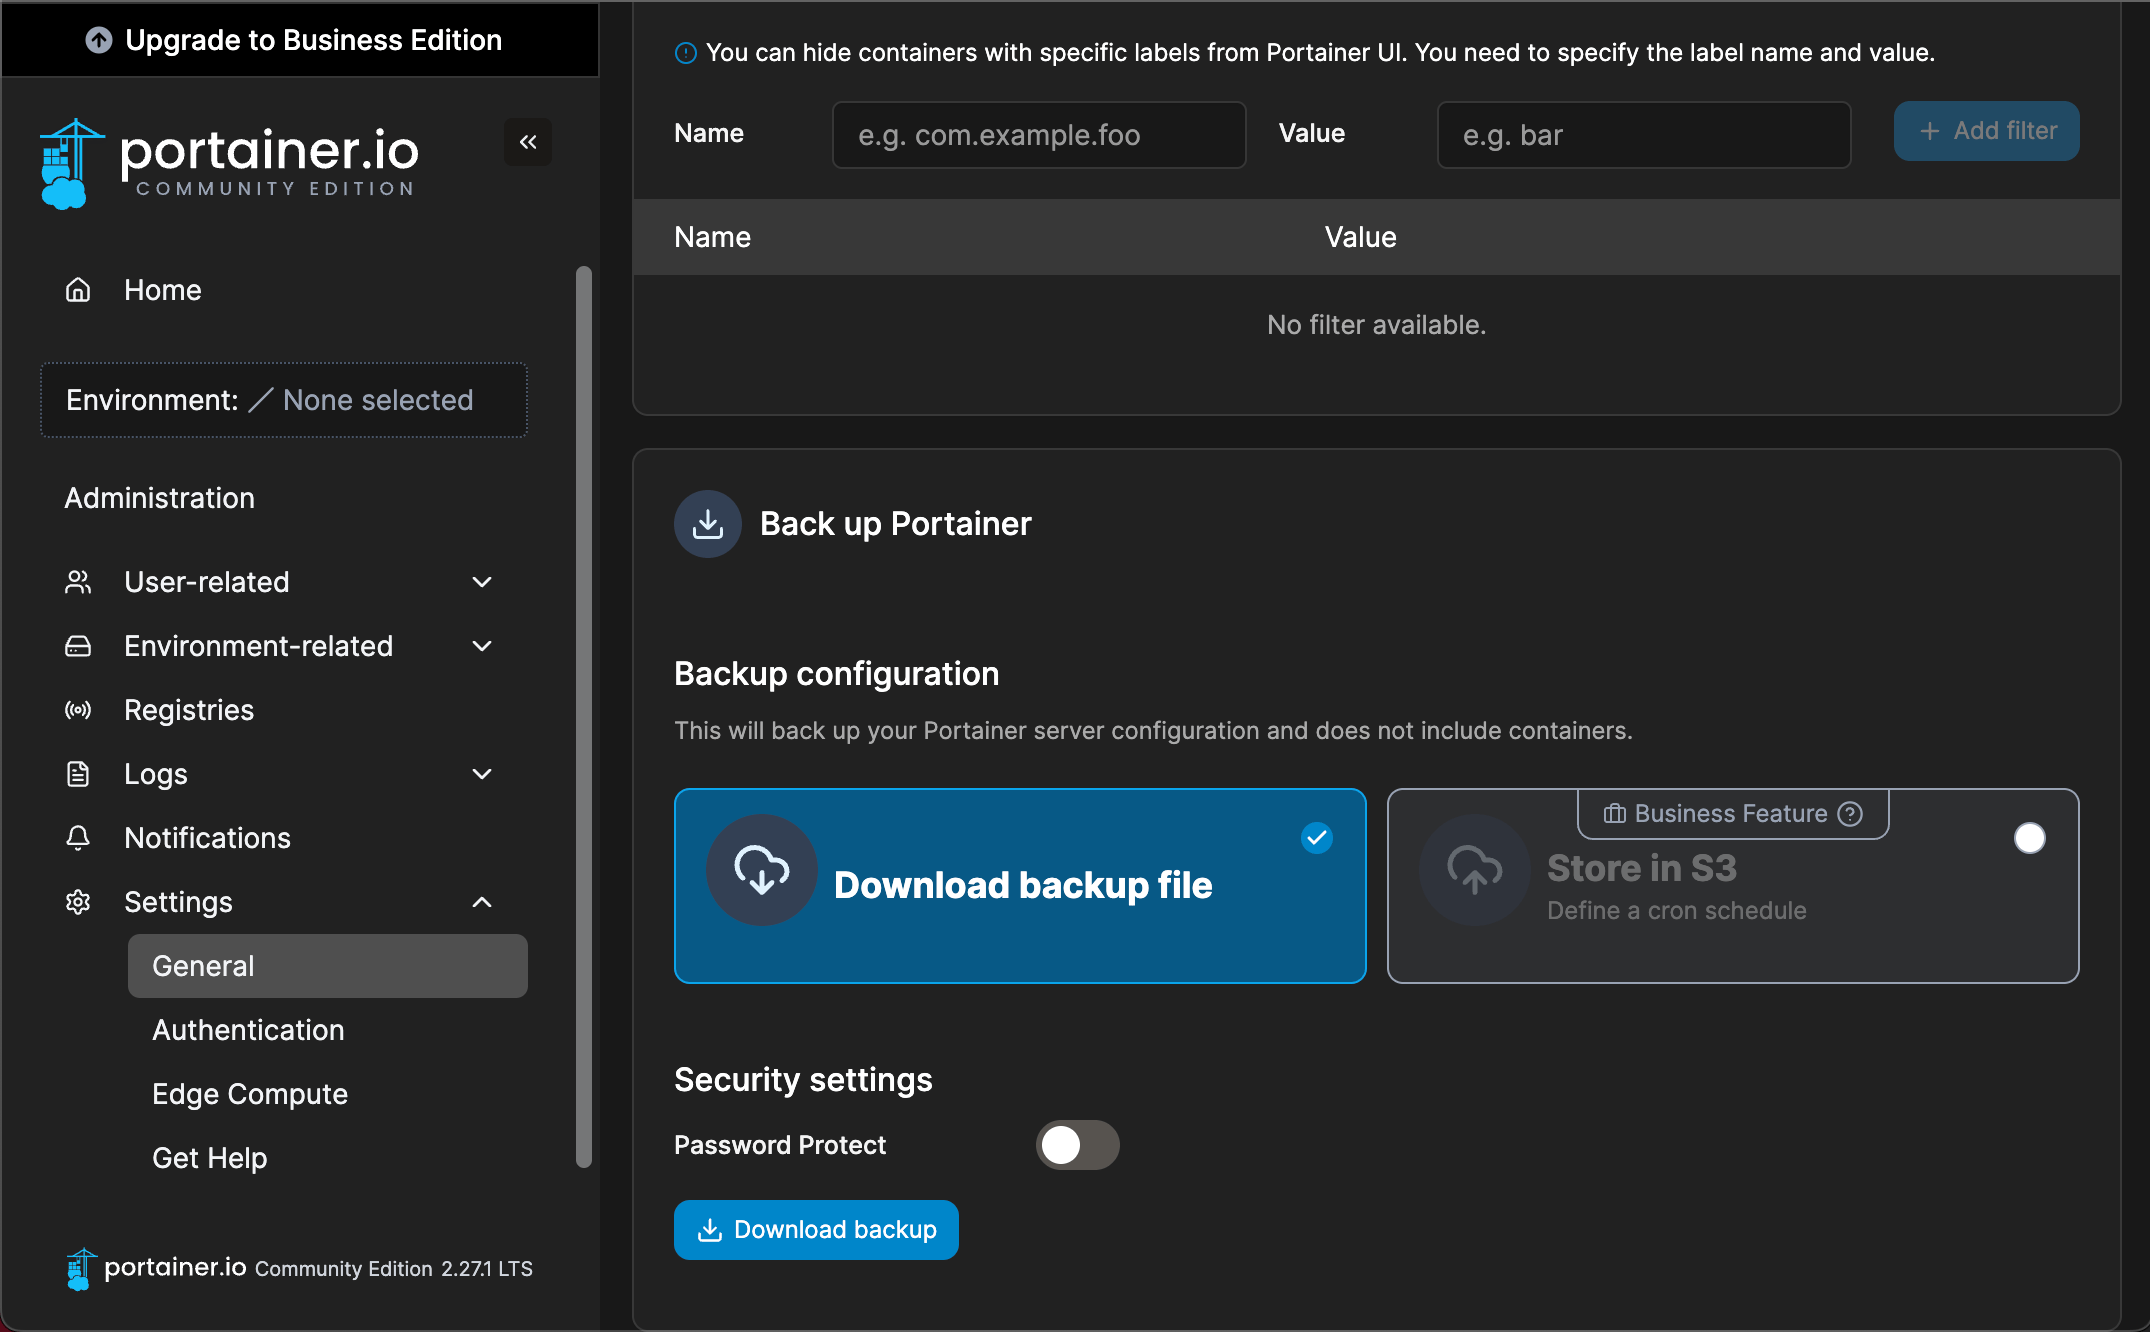
You can back up Portainer’s program configuration using the “Download backup” button under Administration/Settings. After downloading the backup to your PC, move it to the CasaOS Configs folder for Duplicati to backup.
Note that this process does not back up your Stacks, Containers, Images, or Volume Data. It only backs up the Portainer app’s configuration.
You can recreate your Stacks using these two steps –
- First, use the Docker Volume Backup zip files. Restore your persistent volumes in the CasaOS AppData folder.
- Second, use the Docker Compose templates you used to create the containers.
Duplicati Backup Configurations
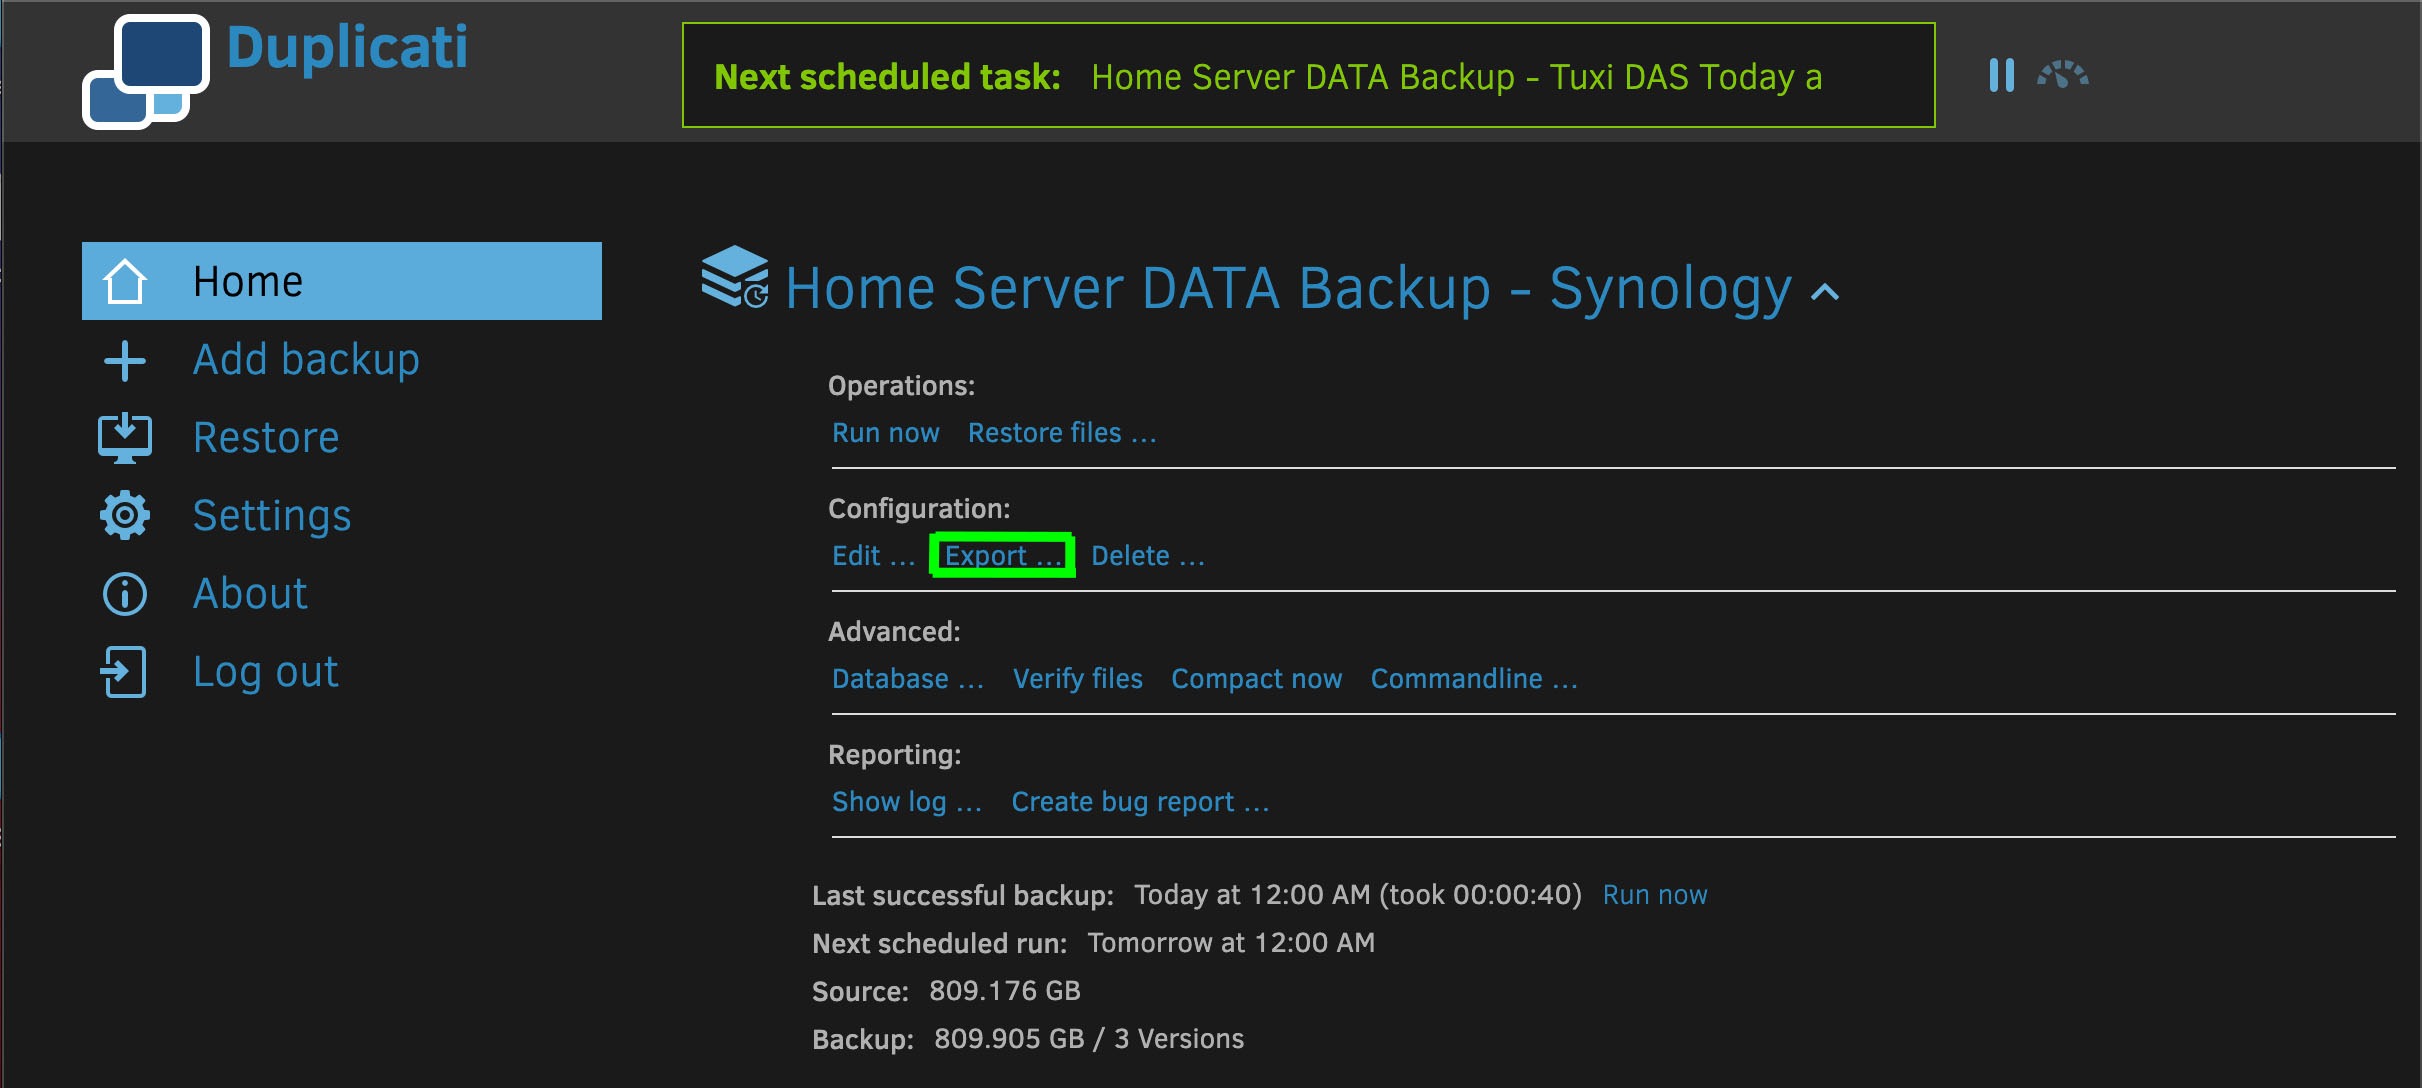
You can back up each Duplicati configuration using the export link on the configuration screen for each associated backup.
You should move the backups downloaded to your PC to the CasaOS Configs folder for Duplicati to backup.
Backup Storage via SFTP
Duplicati can store backups on any device using the SFTP protocol. SFTP is secure and can transfer your backup data over your home network.
Configuring an SFTP Backup Destination in Duplicati
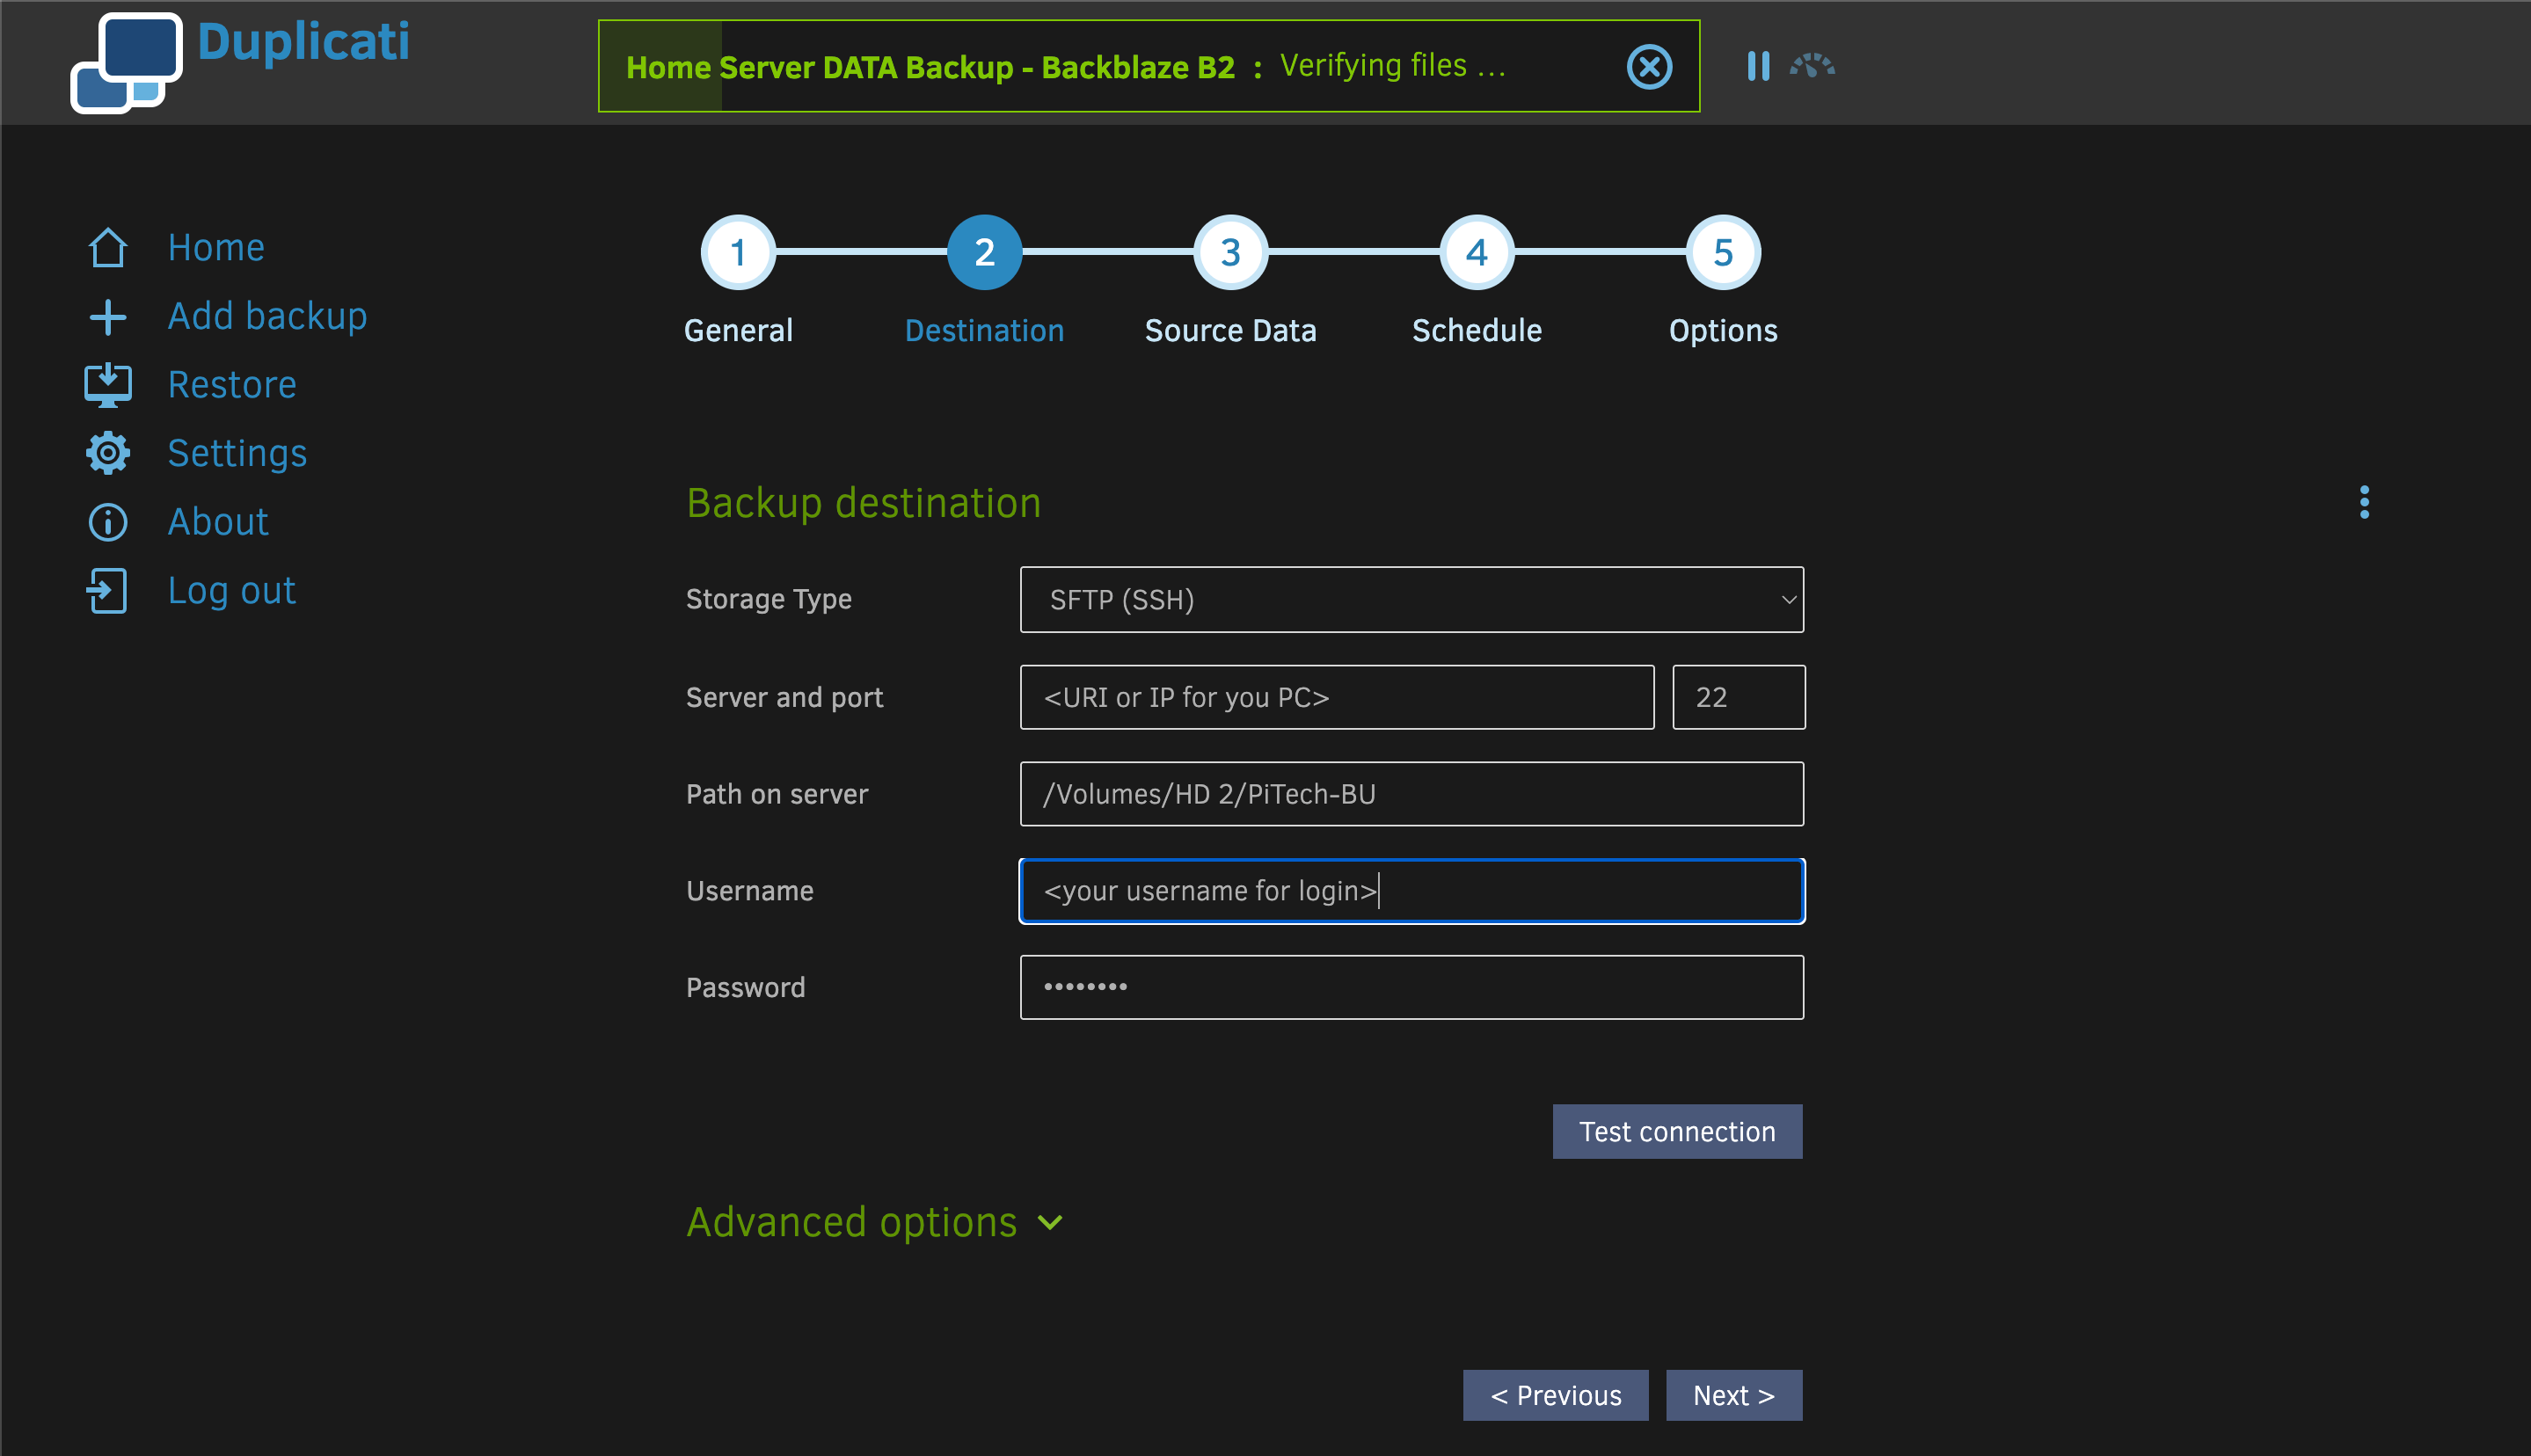
You can set up Duplicati to use any SFTP storage server as a backup destination. Enter the SFTP URI and login information. The Path on server setting depends on the folder on the target device. This folder will store your backups.
Configuring an SFTP Server
You can set up an SFTP storage server on your Windows PC, macOS System, or Synology NAS. The videos below cover how to do this on Windows and macOS.
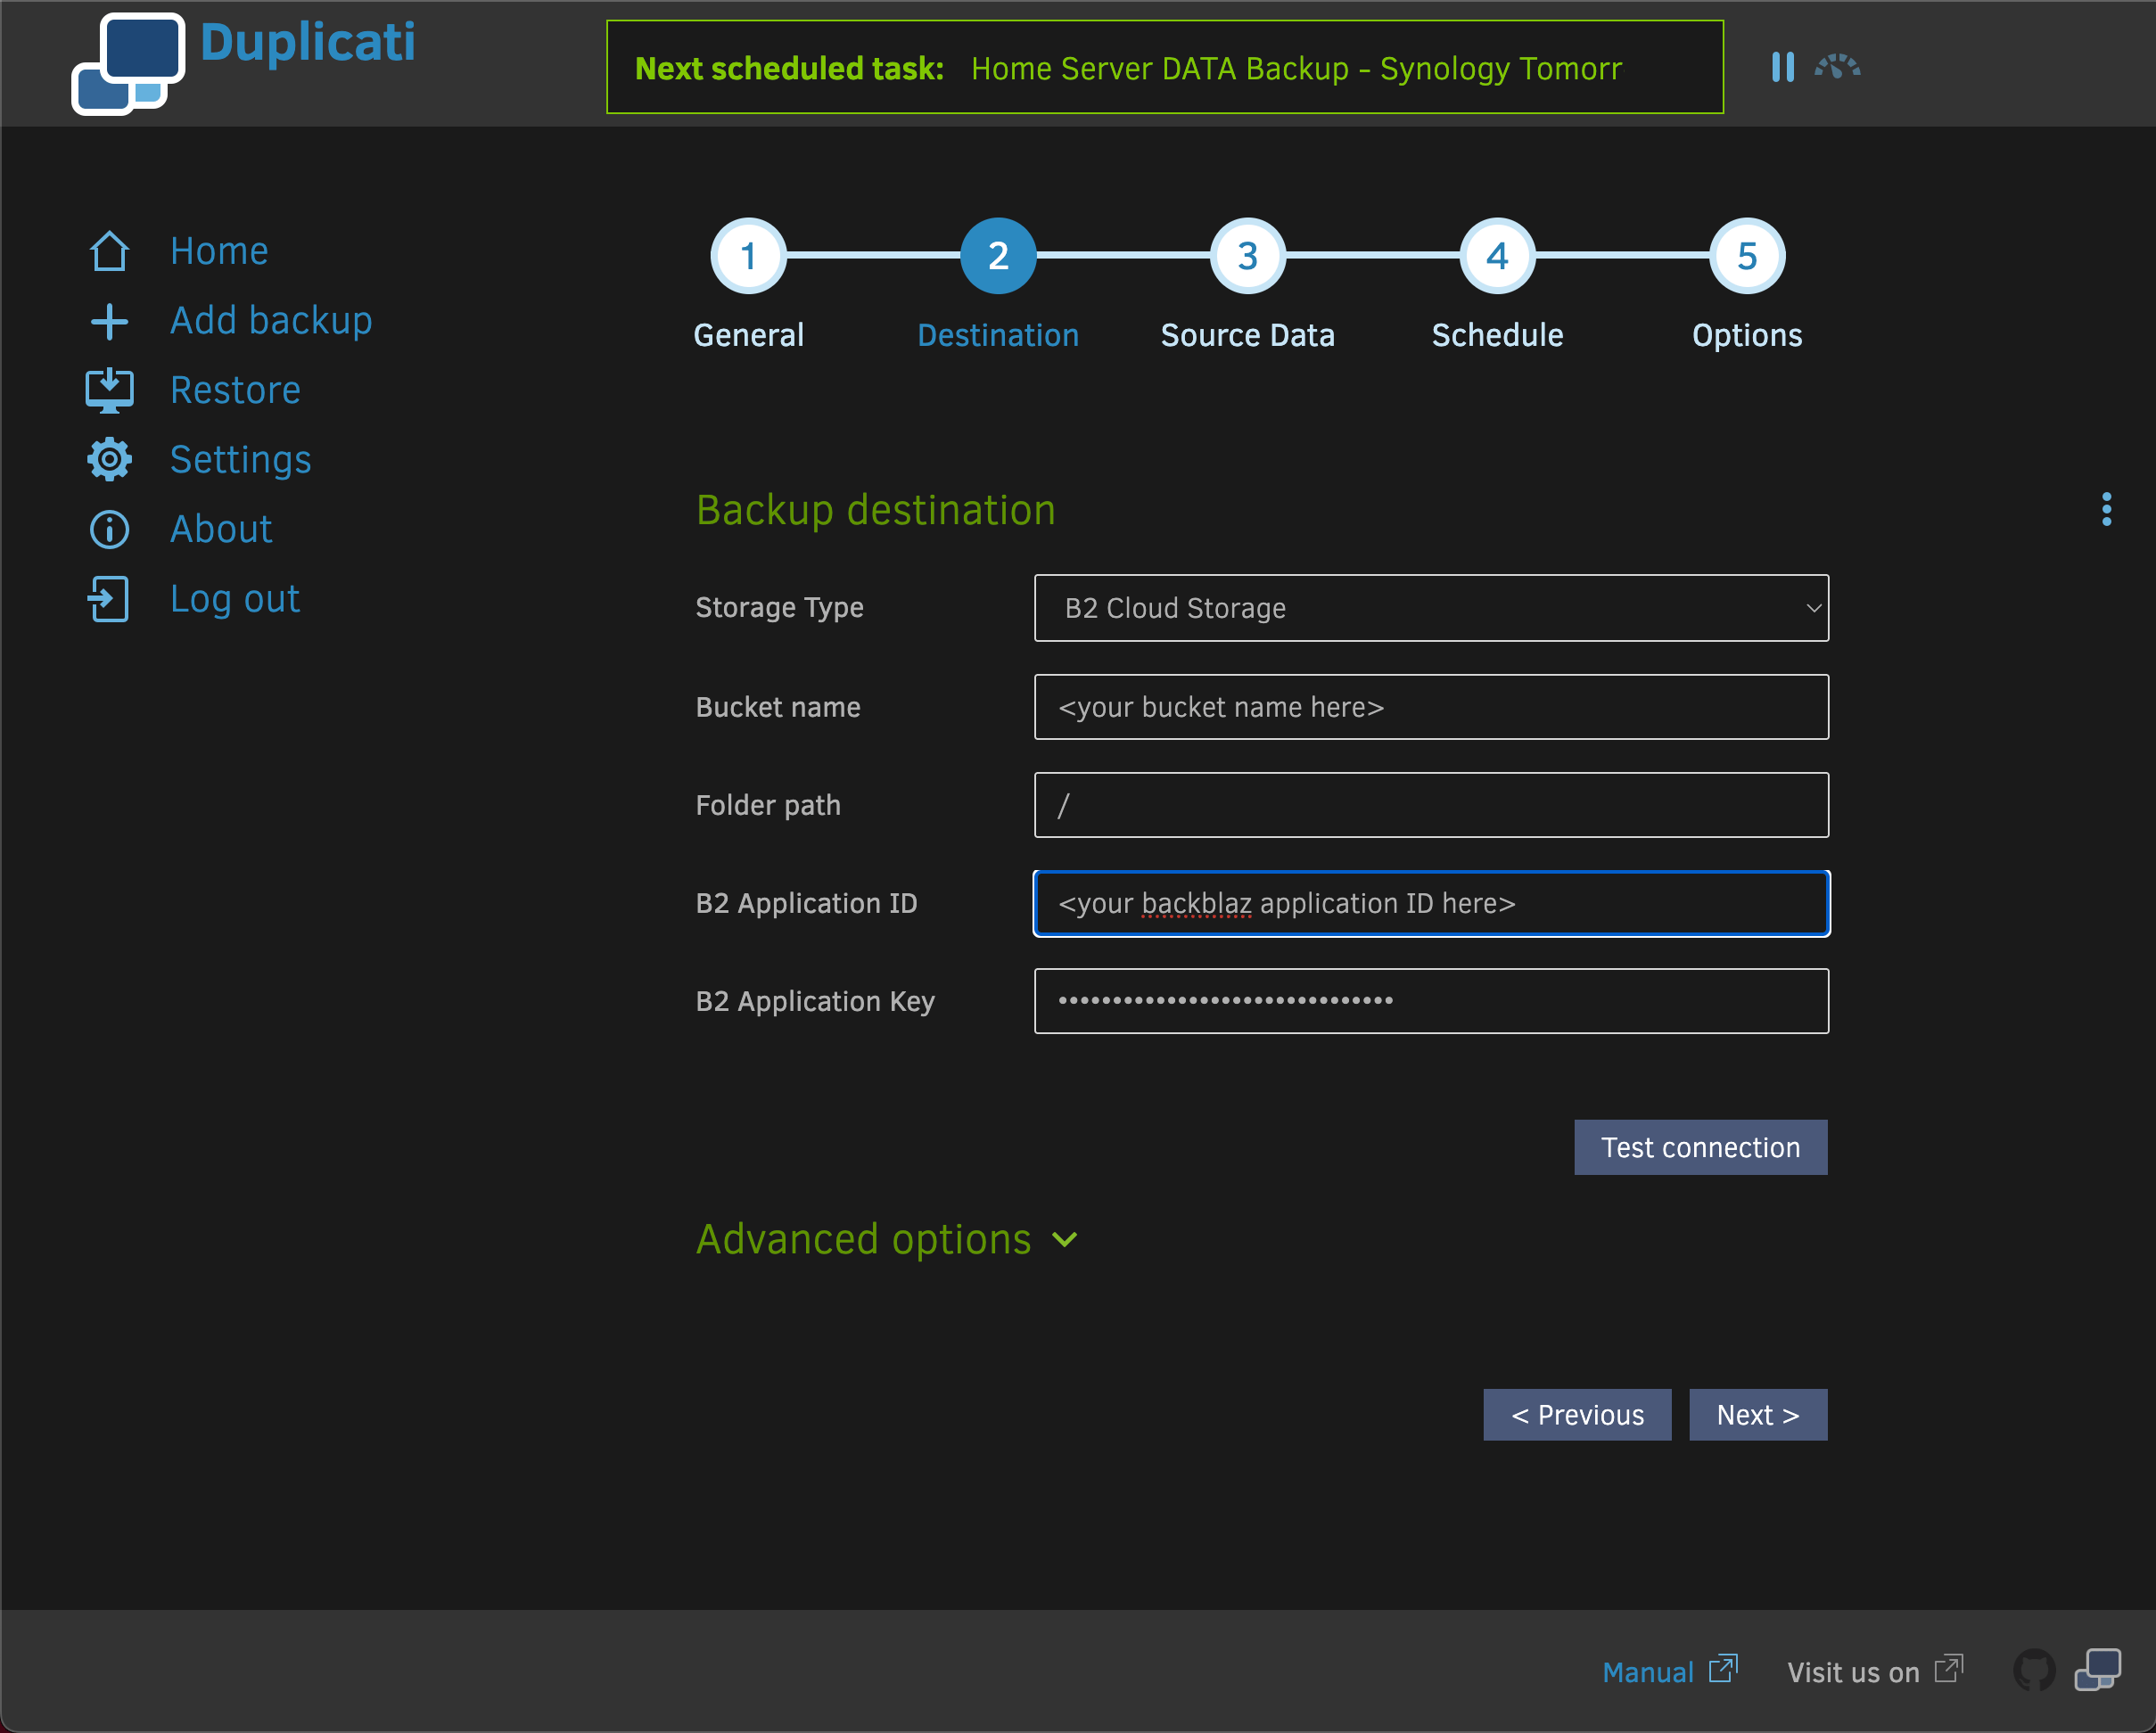
Cloud Backup Storage using Backblaze B2

Backblaze B2 offers cost-effective cloud storage for your backups. To start, sign up for a B2 storage account on Backblaze. Then, create a bucket to store your backups. Finally, set up a backup destination in Duplicati. The configuration in Duplicati is shown below.
Monitoring Using Uptime Kuma
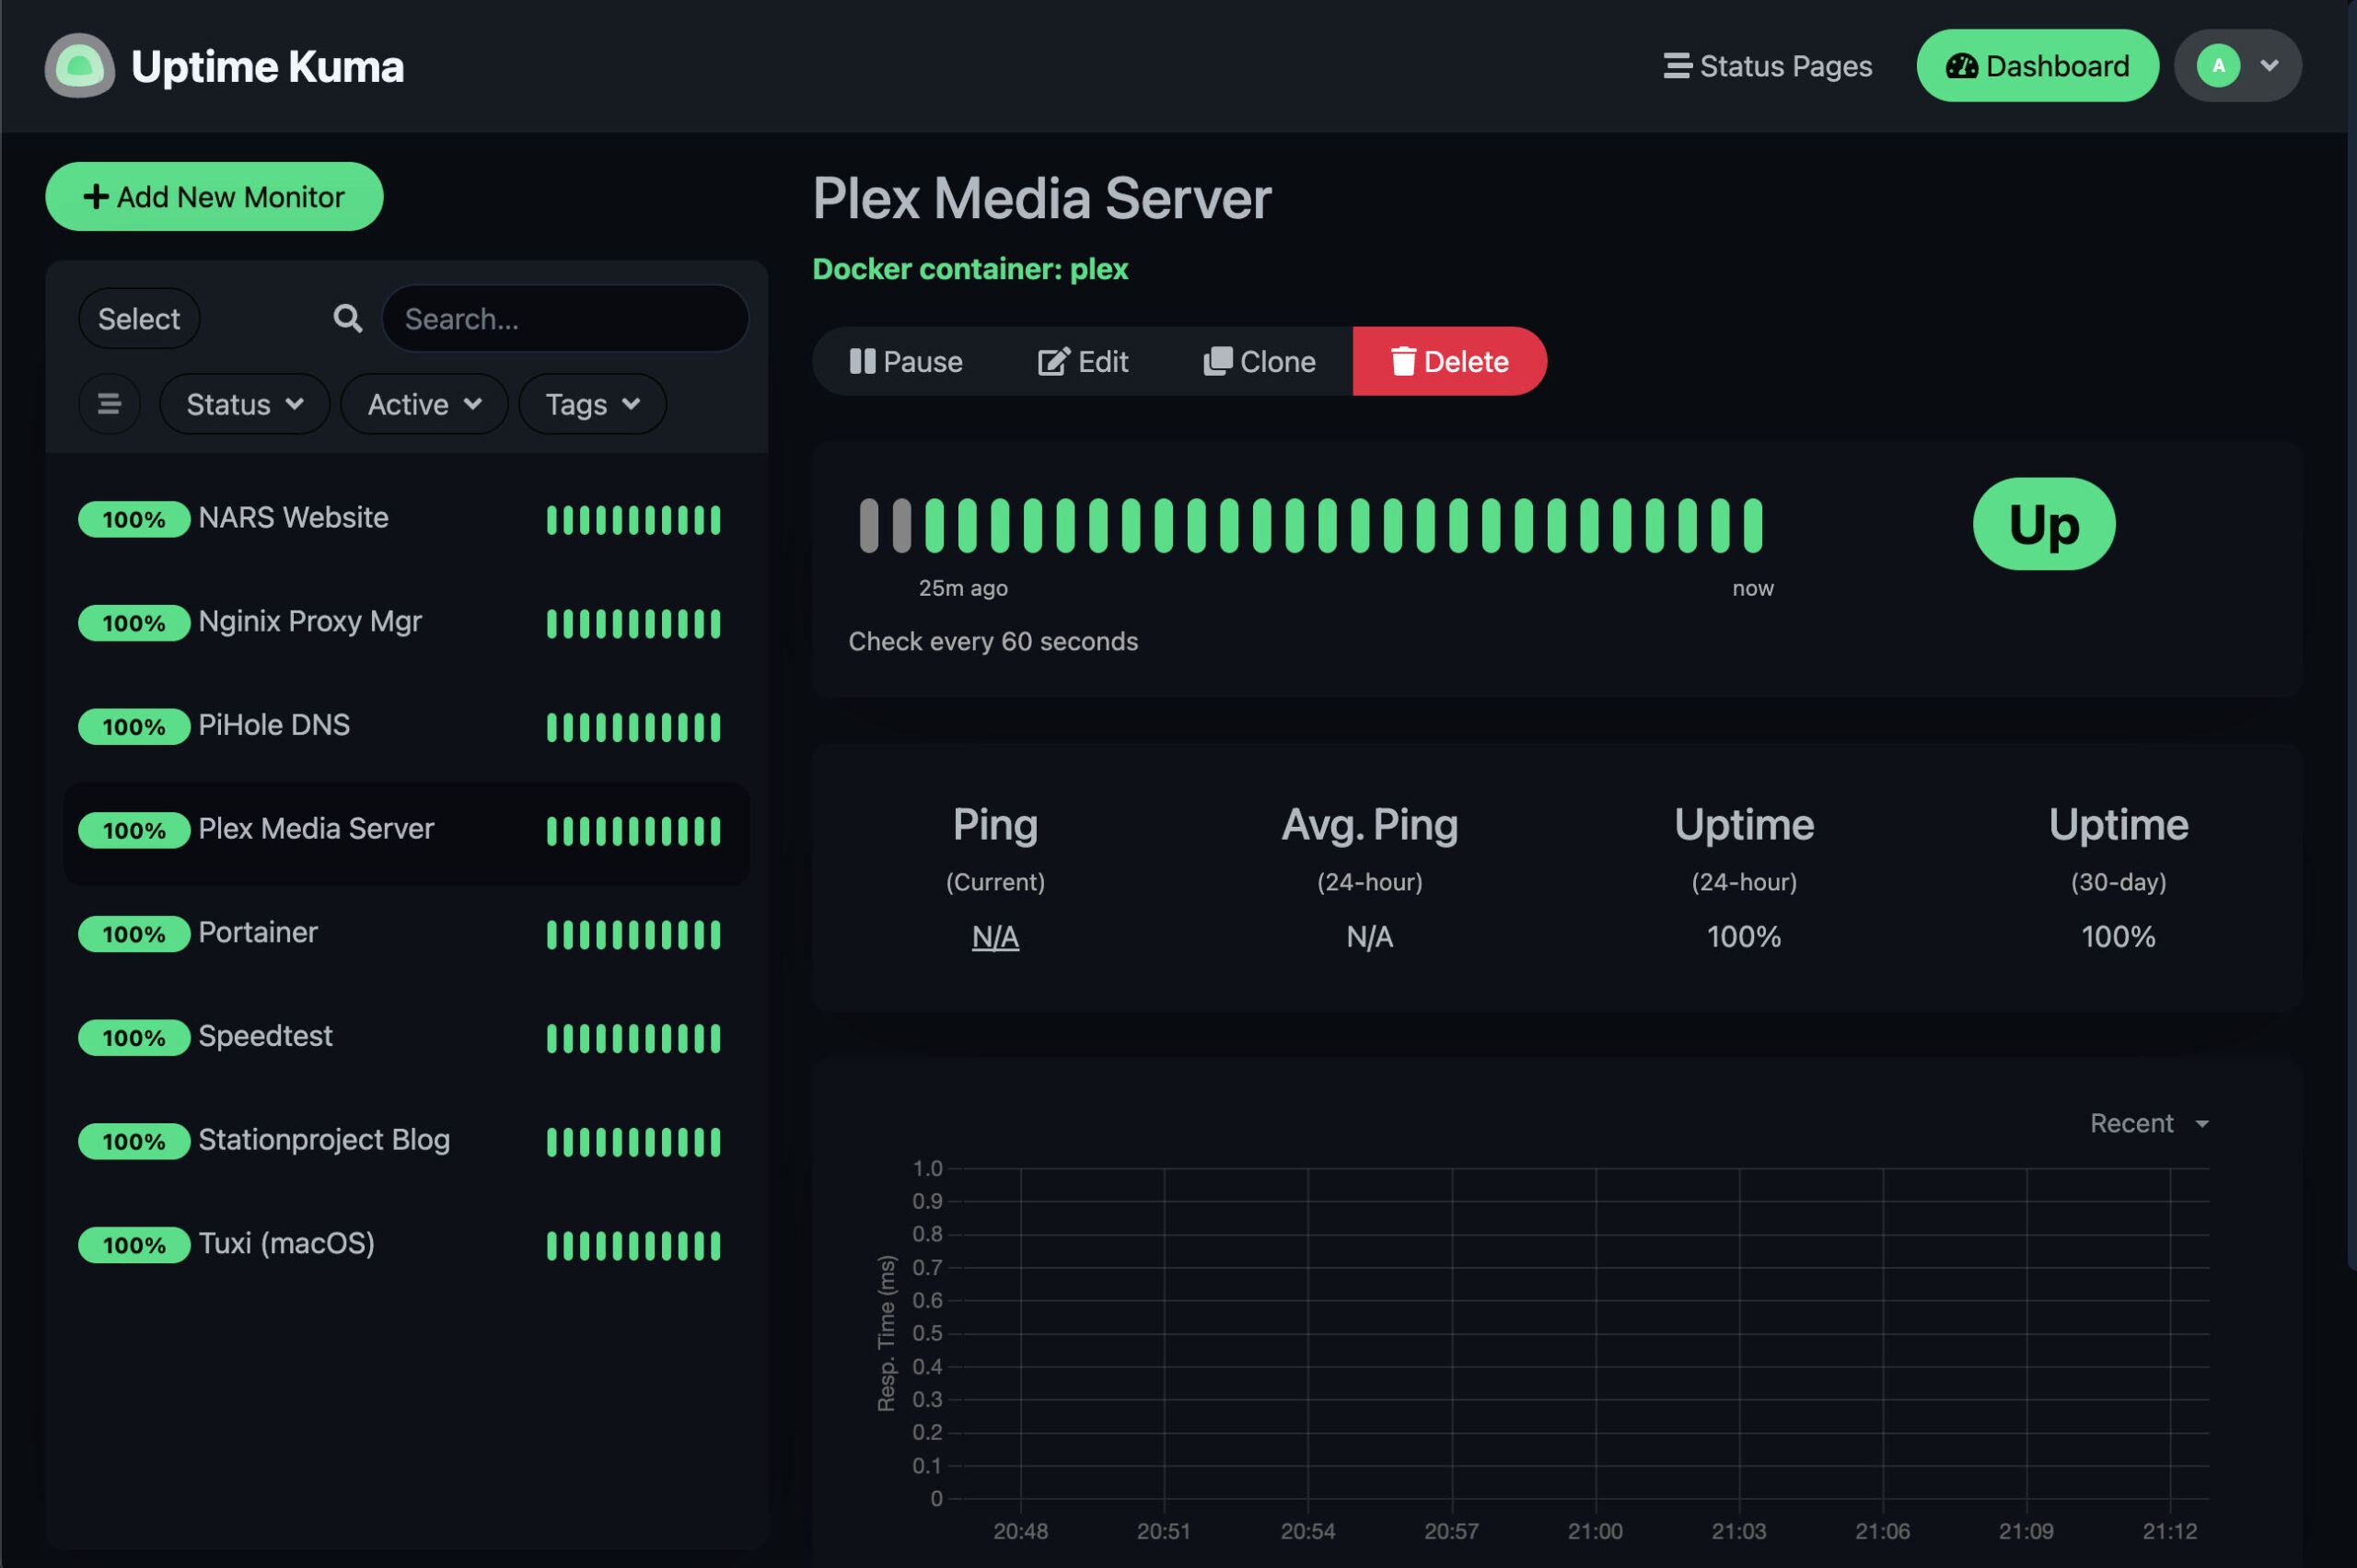
Our next service is Uptime Kuma. This app can check IP devices, services, websites, and anything with an IP address. It helps by confirming that everything on your network is up and running. Additionally, it ensures that everything in the cloud you care about is operational.
We will again use a Portainer Stack to deploy Uptime Kuma. The Docker Compose template is shown below.
# Uptime Kuma: monitor services, websites, and devices
services:
    uptime-kuma:
        container_name: Uptime-Kuma
        image: louislam/uptime-kuma:latest
        restart: unless-stopped
        security_opt:
            - no-new-privileges:true

        # External port for accessing GUI
        ports:
            - '4001:3001'

        # Set specific DNS server to find local services
        dns:
            - <your home server IP>	# Replace with your server IP

        # Persistent storage for configuration/docker access
        volumes:
            - /DATA/AppData/uptime-kuma:/app/data
            - /var/run/docker.sock:/var/run/docker.sock
Configuring Uptime Kuma
You can set up Uptime Kuma to send texts or emails when a monitored device or service goes down. For more information, see the settings sections inside the App.
Home Media Using Plex Media Server
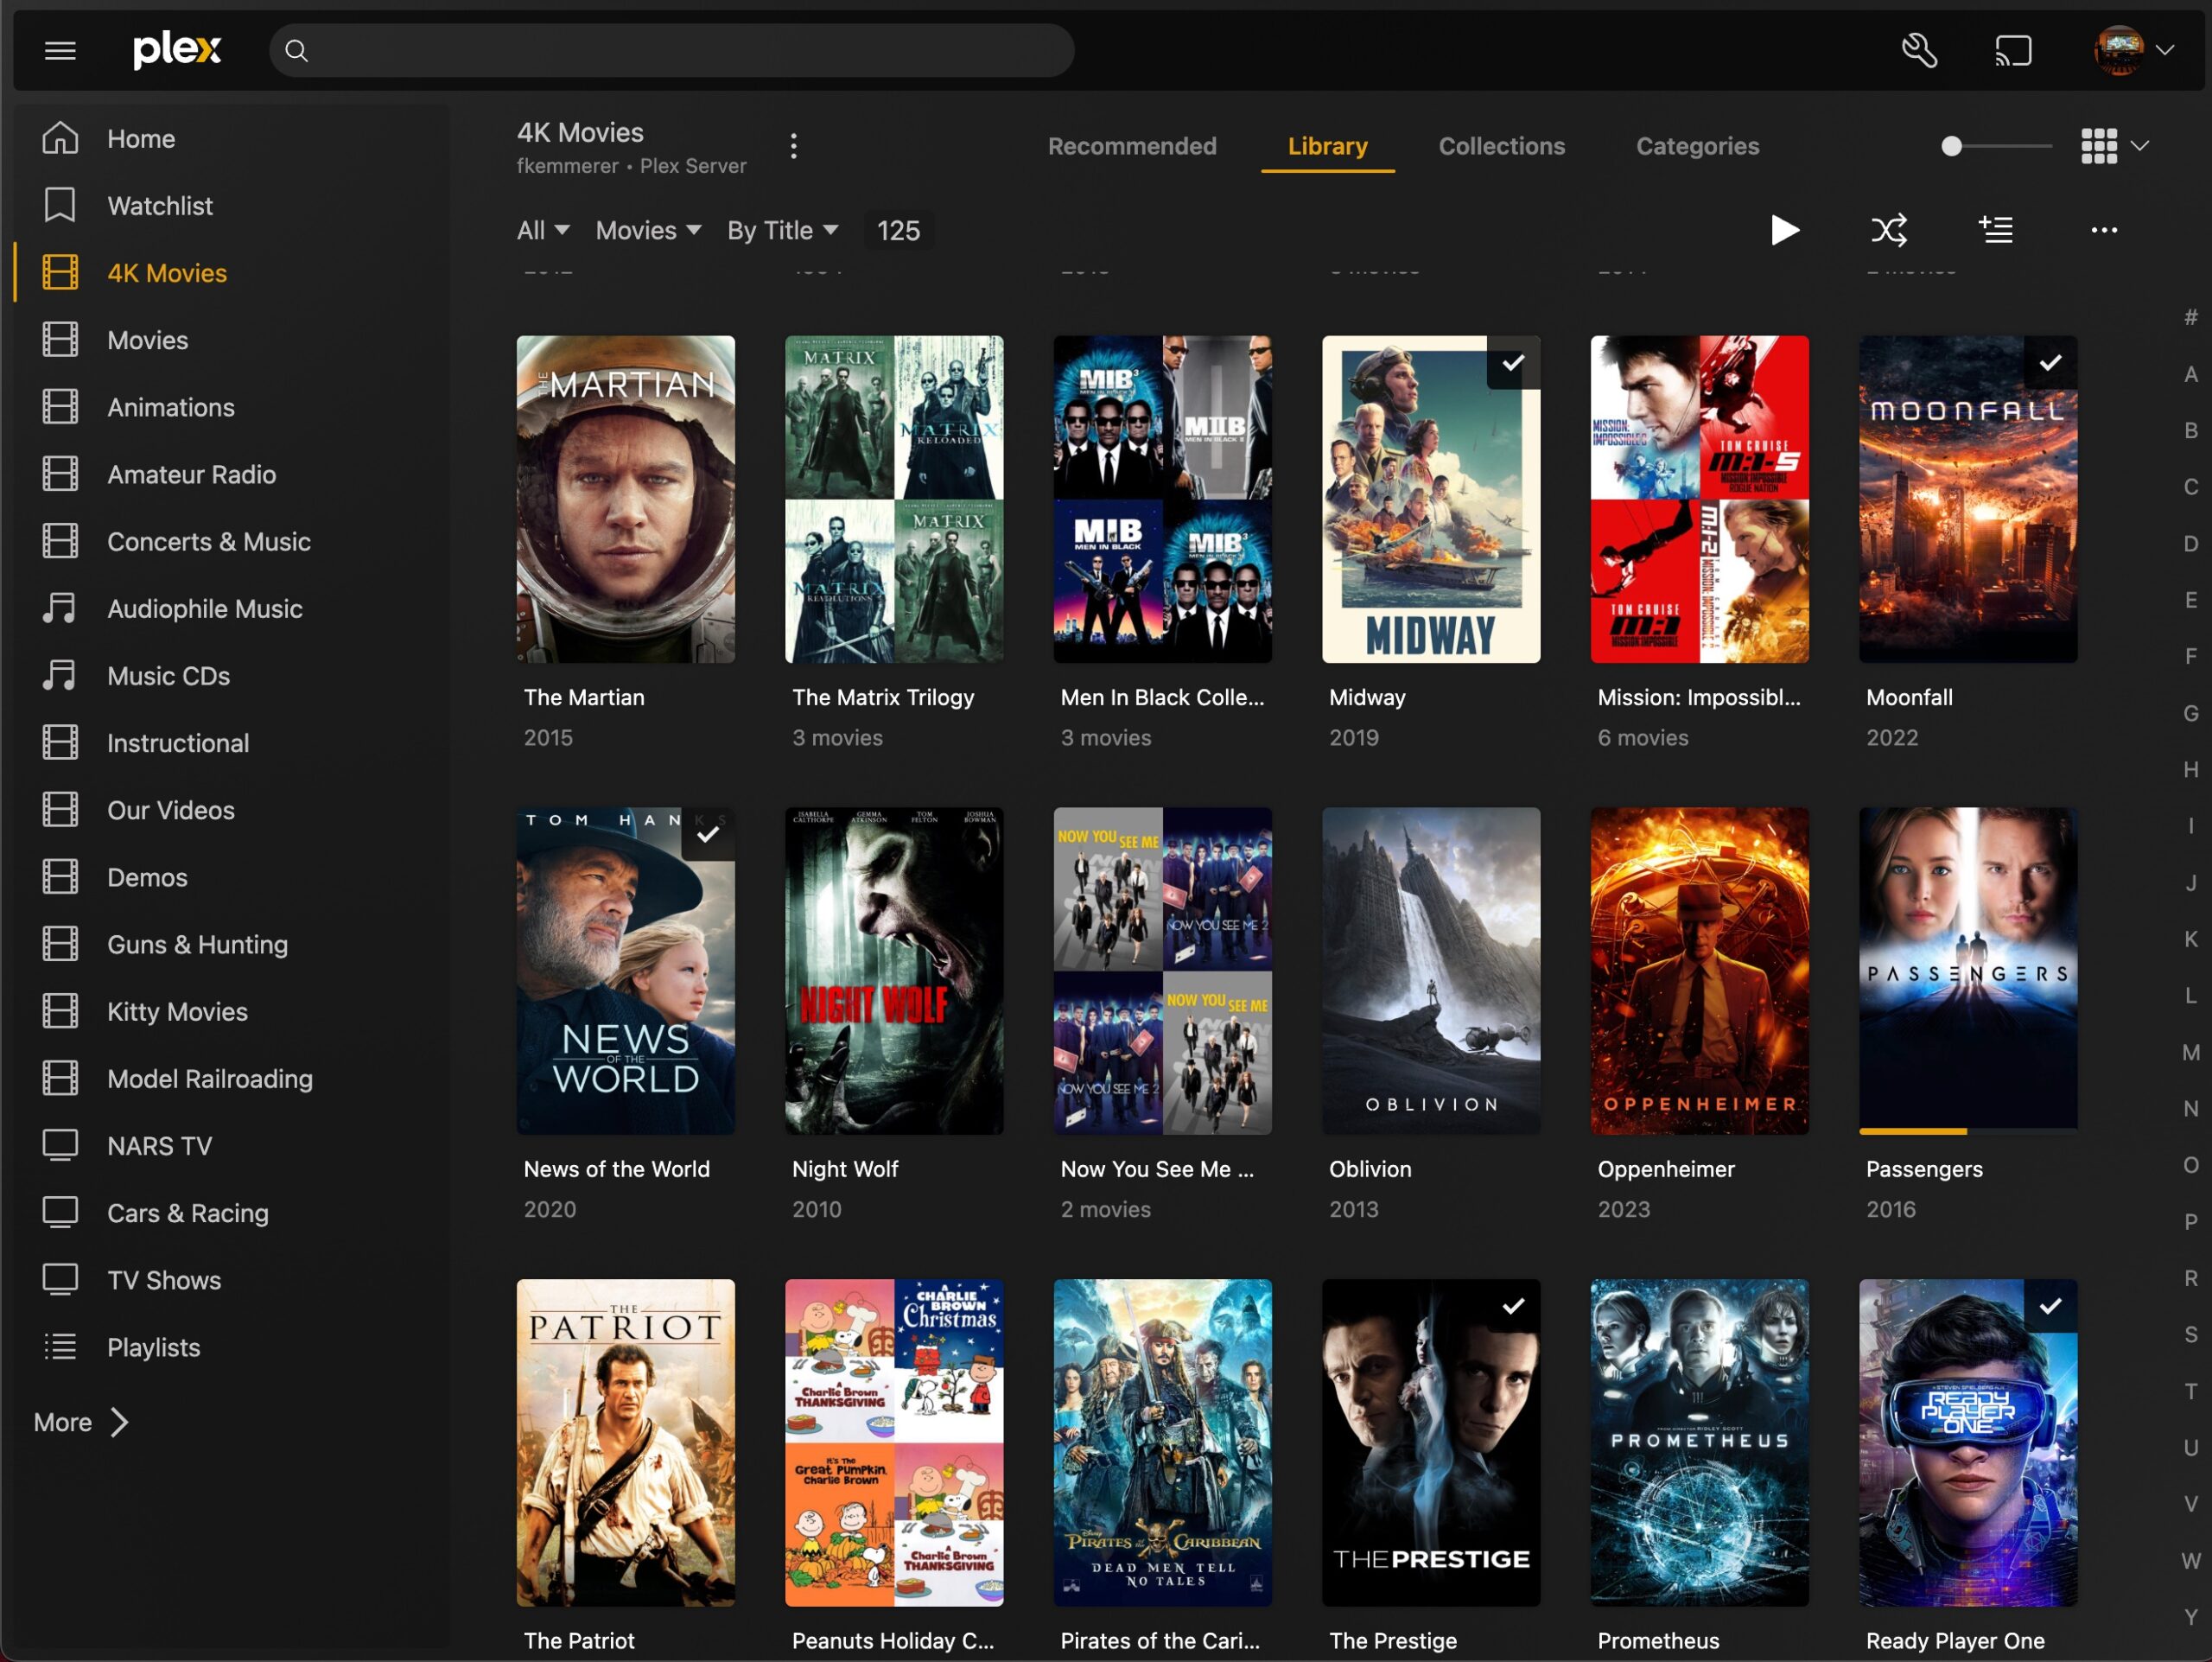
Plex Media Server provides a system for organizing content. Hence, you can build a home media system around Plex.
You must create an account on plex.tv before starting the installation. Also, you will want to open port 32400 in your router and point it to your home server. This will allow you to access your media from outside your home via the Internet.
We can install Plex Media Server using a Portainer Stack. First, prepare your Stack for deployment by obtaining a Plex Claim Token and pasting it into your Stack in Portainer. Note that your Claim Token is only valid for 4 minutes, so you should deploy your Stack quickly. You can use the Docker Compose template below to deploy Plex.
# Plex Media Server: Access multimedia content from anywhere
services:
  plex:
    container_name: plex
    image: lscr.io/linuxserver/plex:latest
    restart: unless-stopped
    security_opt:
      - no-new-privileges:true

    # Causes all Plex media server ports to be passed to the outside
    network_mode: host

    environment:
      - PUID=1000
      - PGID=1000
      - TZ=America/New_York
      - VERSION=docker
      - PLEX_CLAIM=claim-<insert your plex claim token here>

    # Must point to CasaOS Media folders and AppData (for config info)
    volumes:
      - /DATA/AppData/plex/config:/config
      - /DATA/Media/TV Shows:/tv
      - /DATA/Media/Movies:/movies
- /DATA/Media/Music:/musicConfiguring Plex Media Server
Once you have deployed your stack, you can create a subdomain name for Plex in PiHole. Next, set up a proxy host for Plex in Nginx Proxy Manager. Finally, open your Plex Server in your web browser and log in to your account.
You should now have Plex Media Server up and running and ready to be configured. The video below explains how to do so.
Raspberry Pi Home Server Final Cleanup
If you’ve followed all of the steps, you should now have your Raspberry Pi Home Server fully set up. The last thing to do is create shortcuts in the Apps section of your CasaOS dashboard for all your Apps.
Some of your Apps will already have shortcuts. To add a new one, click the “+” on the right side of the Apps label. Then, choose Add external link and set up a link.
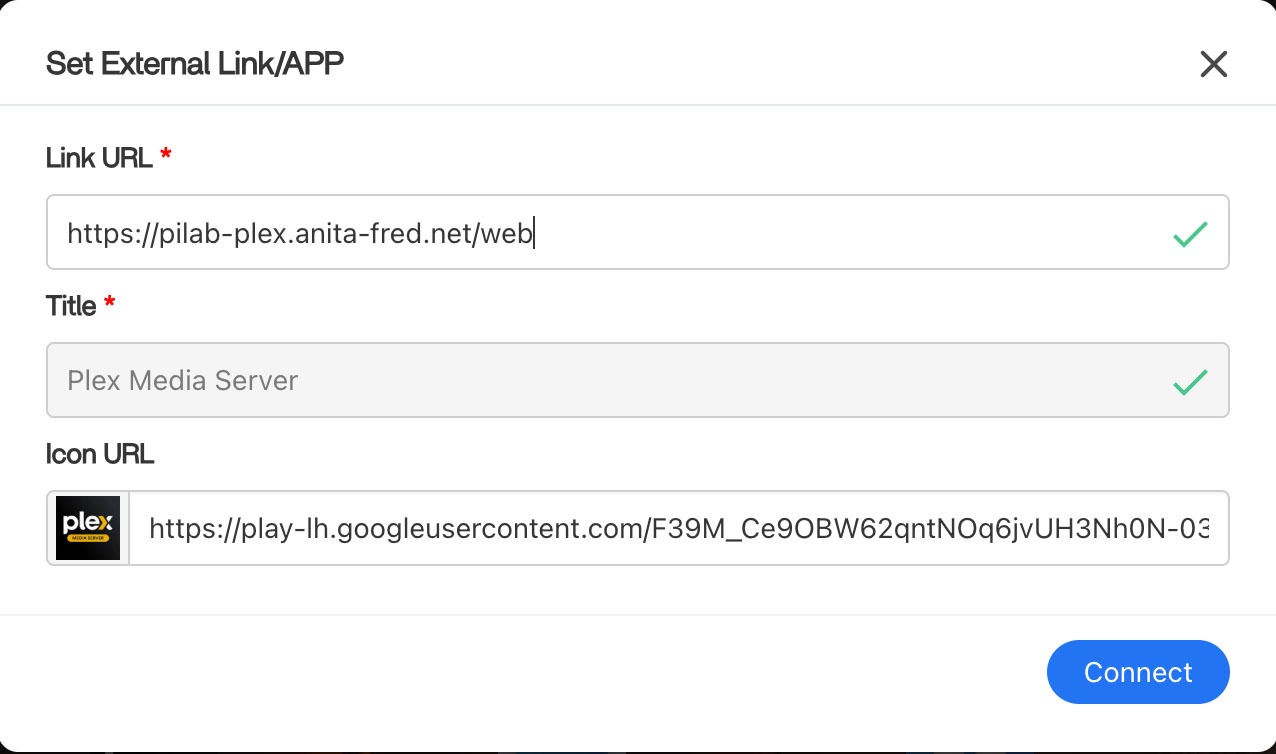
You can use the subdomain names you created for your Nginx Proxy Manager Proxy Hosts. You should use https in your shortcuts. Finally, look around the web for a URL to a small graphic to use as an icon for your shortcut.
Future Projects
If you’ve gotten this far, you now have a capable Raspberry Pi Home Server and NAS. You’ve also built a platform using Cloudflare, Nginx Proxy Manager, and PiHole to allow you to do much more.
Here are a few projects that we plan to do on our home server in the future –
- We’ll be setting up a WordPress website and exposing it to the Internet
- We’ll install Home Assistant and use it to manage our Smart Home devices
- Also, we’ll be installing a home lab dashboard like Dashy to offer a simple user interface for all of our services
Many of these services are already running on the Docker/Portainer system that runs on our Proxmox Cluster. You can also find information about these here.